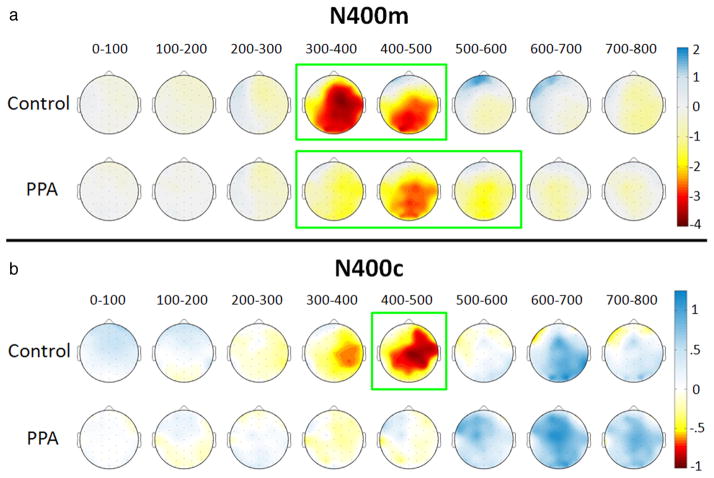
Figure 3.
Topographic plots of N400 effects over 100 ms intervals. Negative potentials are shown in yellow/red and positive potentials are shown in blue, corresponding to microvolt values shown on the color scale, as interpolated across a schematic view of the head as viewed from above. a, N400m amplitudes were calculated as mean amplitudes for the related mismatch condition minus the matching condition. Intervals are demarcated in green for significant N400m effects for the bilateral central/posterior cluster. b, N400c amplitudes were calculated as mean amplitudes for the unrelated mismatch condition minus the related mismatch condition. Intervals are demarcated in green for significant N400c effects in the same electrode cluster.

