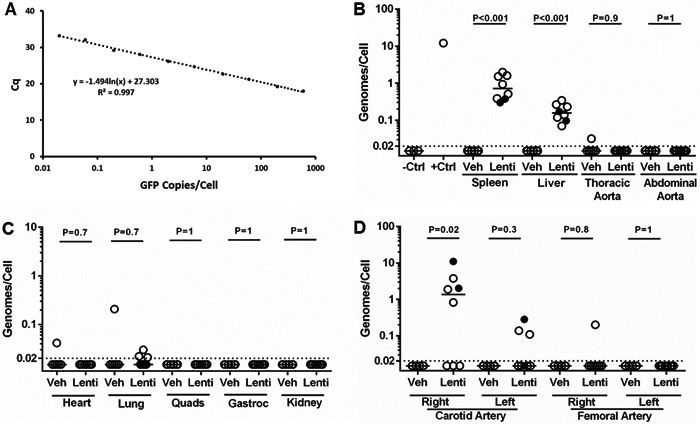
Figure 1. No aortic transduction after in vivo lentiviral vector (LV) injection.

(A) Standard curve made by mixing green fluorescent protein (GFP)-containing plasmid with genomic DNA extracted from ex vivo mock-transduced aorta and measuring cycle quantification (Cq) values of the GFP amplicon. (B–D) LV genomes per diploid cell were measured by quantitative PCR for the GFP sequence, performed on DNA extracted from indicated tissues, with reference to a standard curve (A). Filled circles indicate, among samples from mice injected with LV provided by the Redondo laboratory (n=2), those with positive PCR reactions. (B) The negative control samples (−Ctrl) are DNA extracted from mock-transduced aortic segments (n=3). The positive control sample (+Ctrl) is DNA extracted from an aortic segment transduced ex vivo (n=1). (C) Data are from right-sided lung, muscles, and kidney; for left-sided results, see Figure IV in the online-only Data Supplement. (B–D) Dotted line=limit of detection; data points are from individual mice; bars are medians; P values are from Mann-Whitney rank-sum test. Veh=vehicle-injected (n=6 for all tissues); Lenti=lentivirus-GFP injected (n=8 for all tissues); Gastroc=gastrocnemius; Quads=quadriceps.
