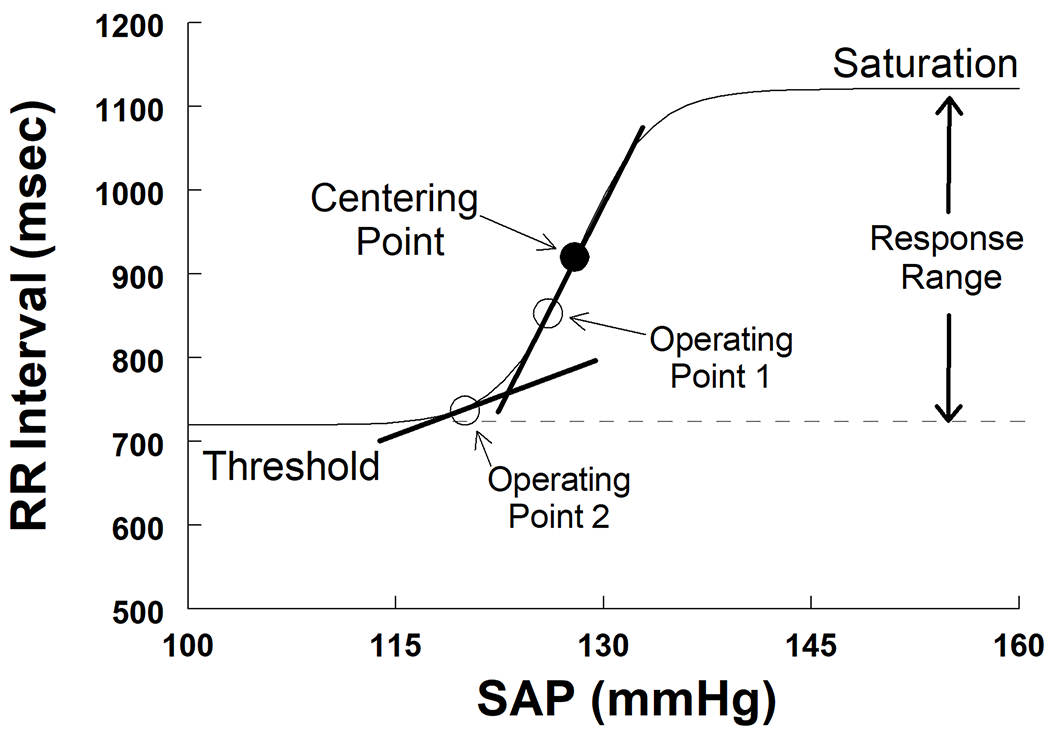
Figure 1.

shows an idealized cardiovagal baroreflex as a sigmoidal relationship between SAP and RR-interval over a wide range of pressures. The sigmoid curve can be uniquely specified by 4 parameters: the systolic BP (SAP) at the centering point, the slope at the centering point (maximum gain or baroreflex sensitivity, Gmax), the curve’s threshold, and its response range. Operating points define the current state of the system; local slopes at operating points and correspond to the variation of RR-interval with variation of BP (BPV) near 0.1Hz near that particular operating point.
