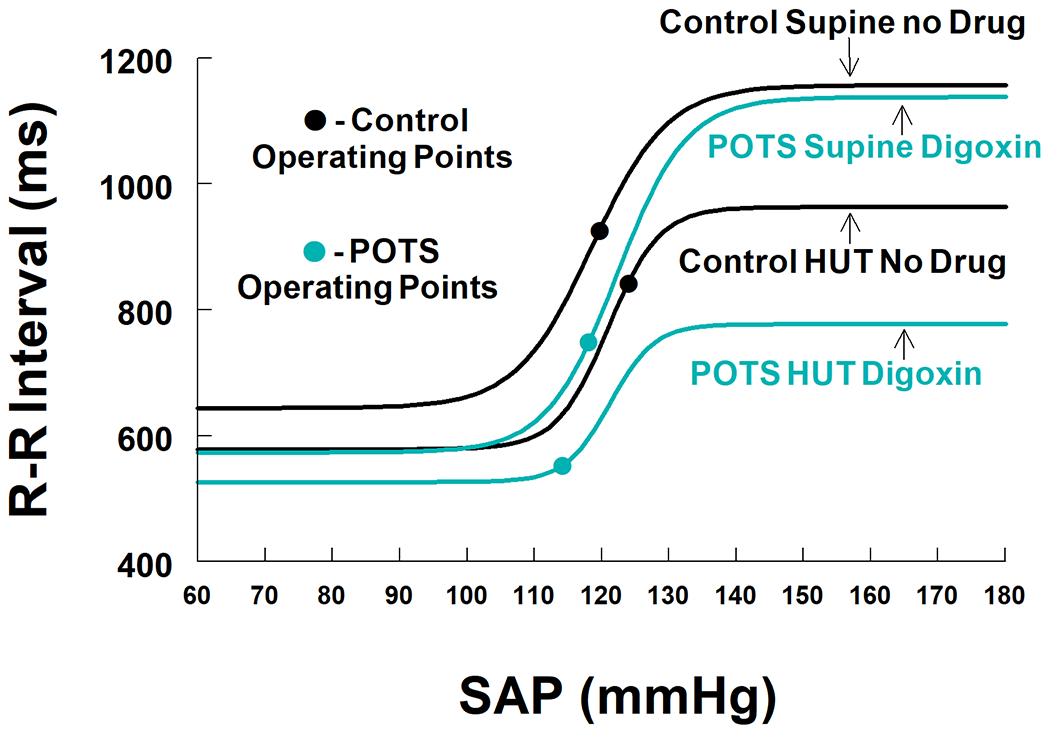
Figure 5.

compares POTS patients treated with digoxin (teal lines) with control (black lines) supine and during head up tilt (HUT). Operating points are shown by cyan and black circles. Digoxin returns the Centering point and Gmax of POTS patients to similar to control values. The response range supine post digoxin is greater in treated POTS than control. After tilt, threshold was more in POTS while SAP at centering point and Gmax were sustained. However, response range decreased markedly with tilt in POTS and contributed to the left shift of the operating point for digoxin and consequently reduced operating point slope.
