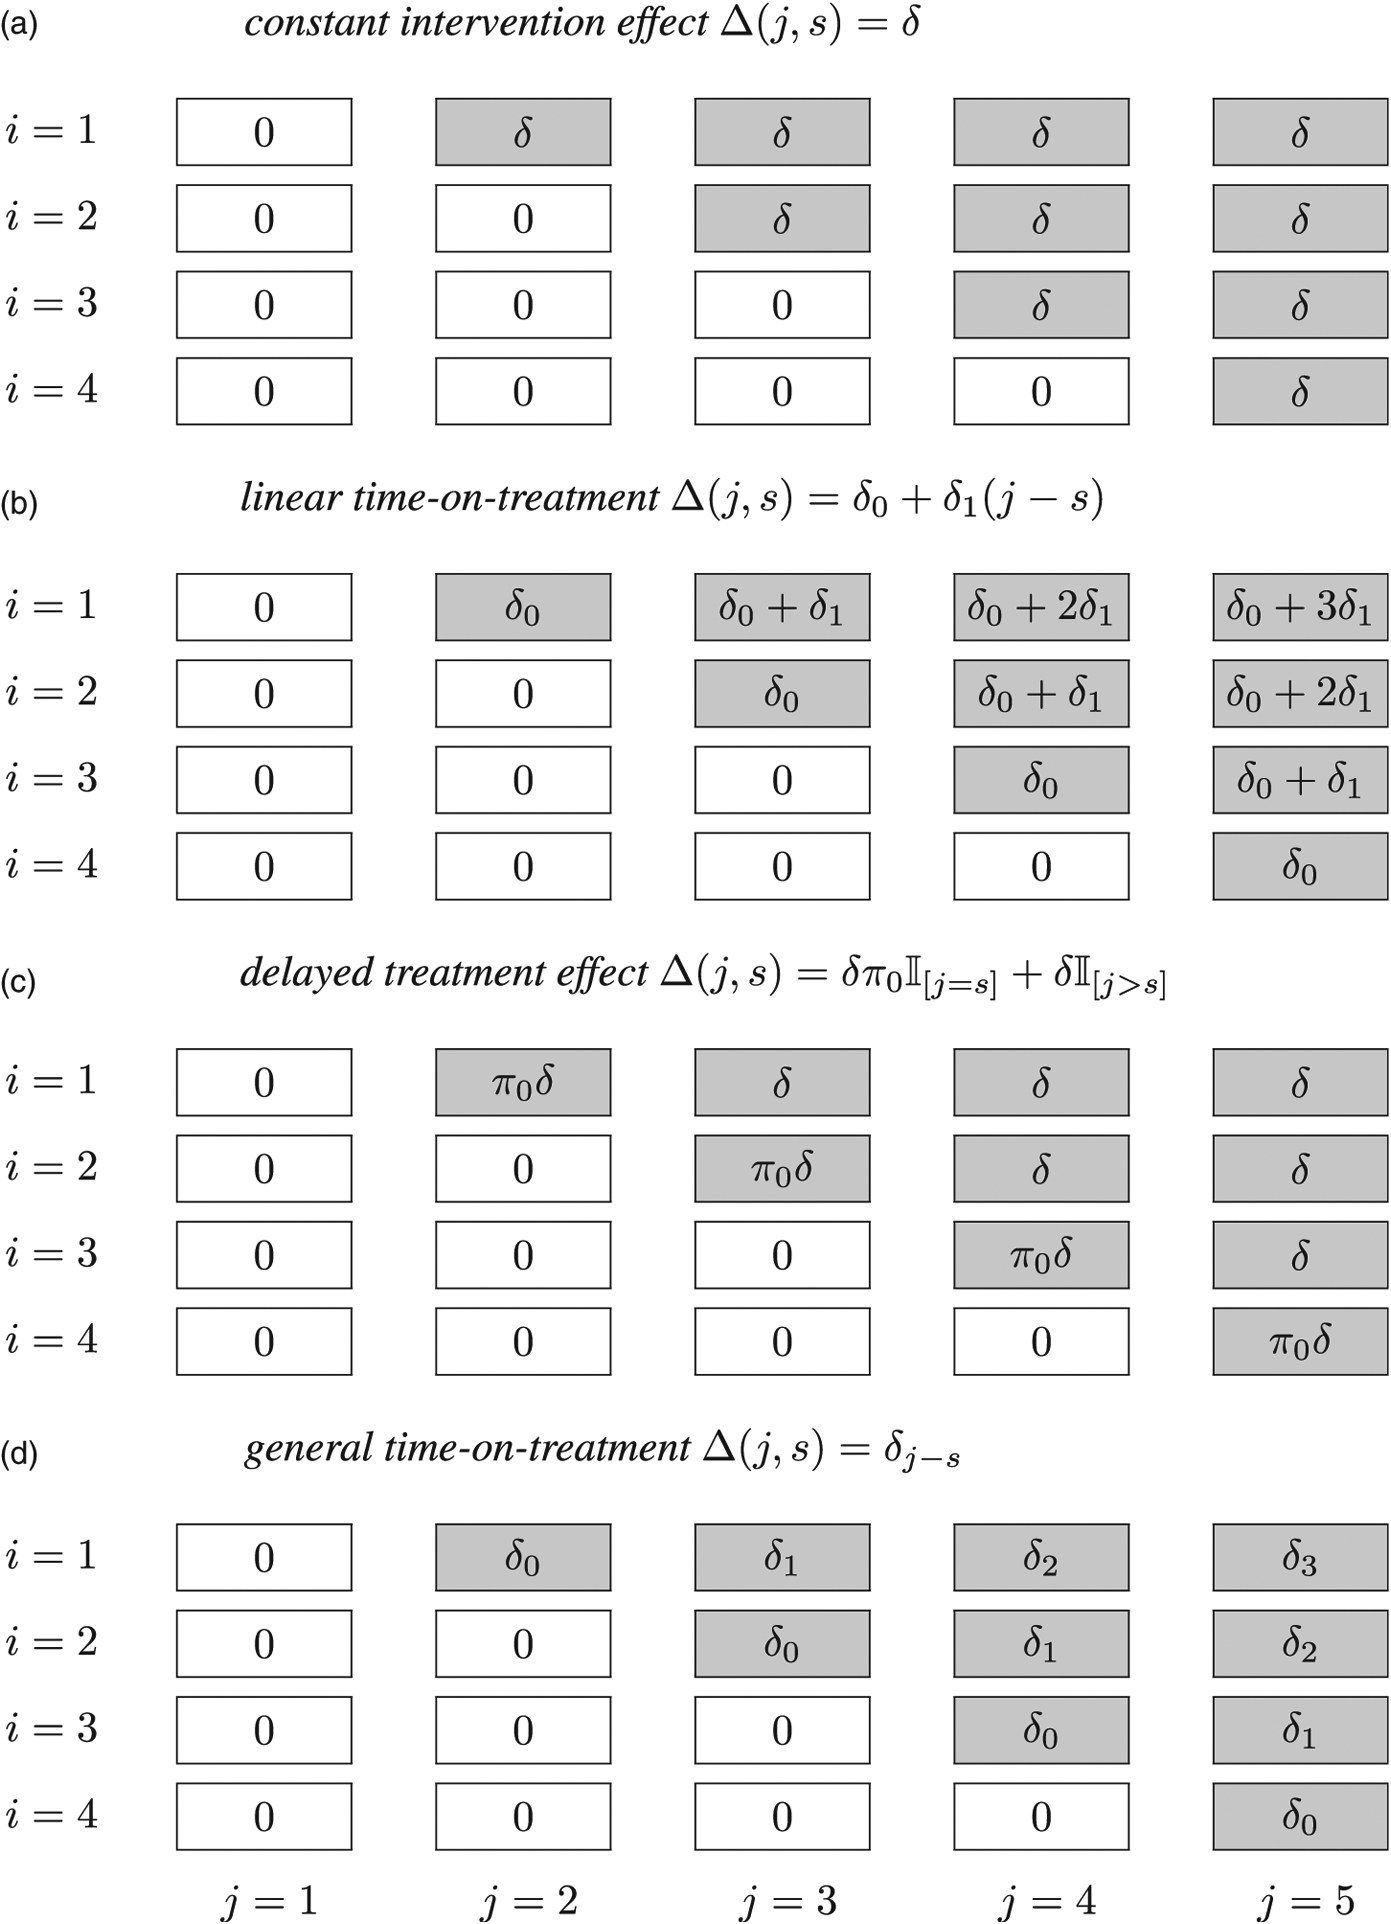
Figure 2.

Schematic illustrations of four intervention effect representations in a stepped wedge design with I = 4 clusters and J = 5 periods. Each cell with a zero entry indicates a control cluster-period and each cell with a non-zero entry indicates an intervention cluster-period.
