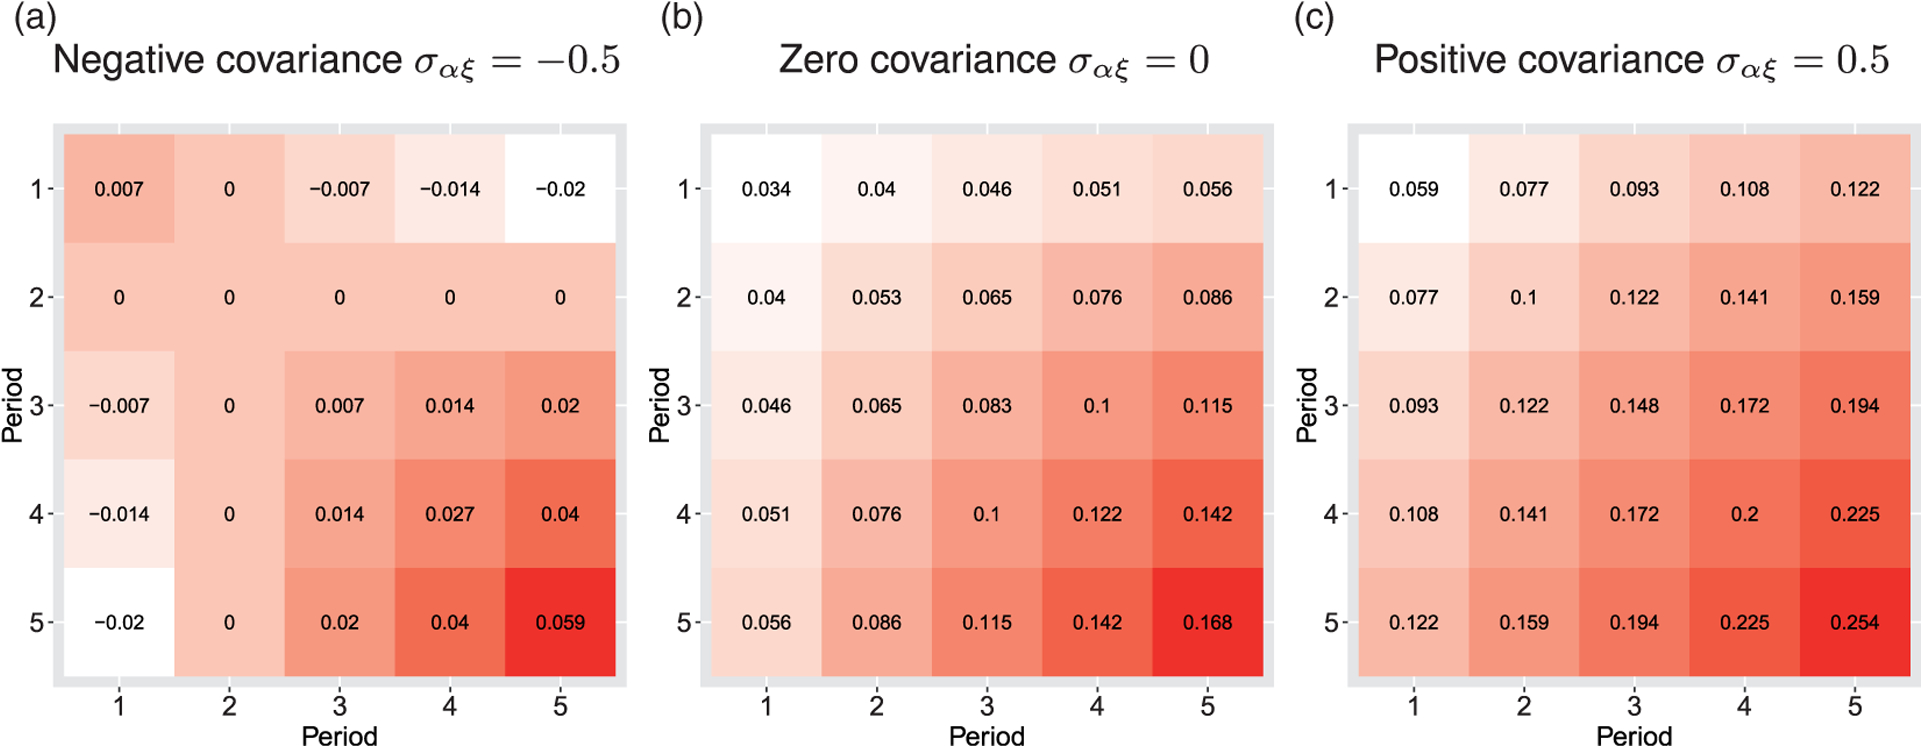
Figure 3.

Three examples of within-cluster correlation patterns implied by the random coefficient model. A trial with J = 5 is assumed throughout; the diagonal cells present the within-period ICC values, while the off-diagonal cells present the between-period ICC values. White color indicates a smaller ICC value while red color indicates a larger ICC value. The variance components parameters are assumed as σϵ = 6, τα = 1, τξ = 0.5 and the covariance parameter (a) σαξ = −0.5, (b) σαξ = 0, (c) σαξ = 0.5. (a) Negative covariance σαξ = −0.5; (b) Zero covariance σαξ = 0; (c) Positive covariance σαξ = 0.5.
