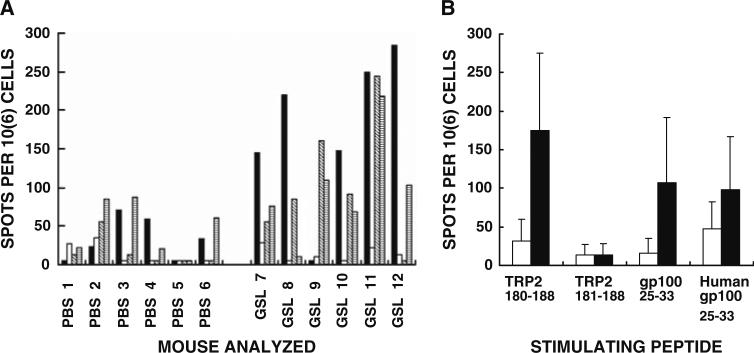
Fig. 3.
ELISPOT data from mice with B16 tumors injected with PBS, or with α-gal glycolipids (GSL-glycosphingolipids), and which are stimulated in vitro with various immunodominant MAA peptides (n = 6 mice per group). a Data with spleen lymphocytes from individual mice stimulated with the following MAA peptides: TRP2180–188 (closed columns); TRP2180–188 without S180 and V187 (TRP2181–188 open columns); mouse gp10025–33 (diagonal hatched columns); human gp10025–33 (horizontal hatched columns). Data presented as number of IFNγ spots per million lymphocytes (i.e., T cells secreting IFNγ/106 cells). b Data presented as mean + standard deviation of ELISPOT response to the various MAA peptides in mice with tumors treated with PBS (open columns), or with α-gal glycolipids (closed columns)

