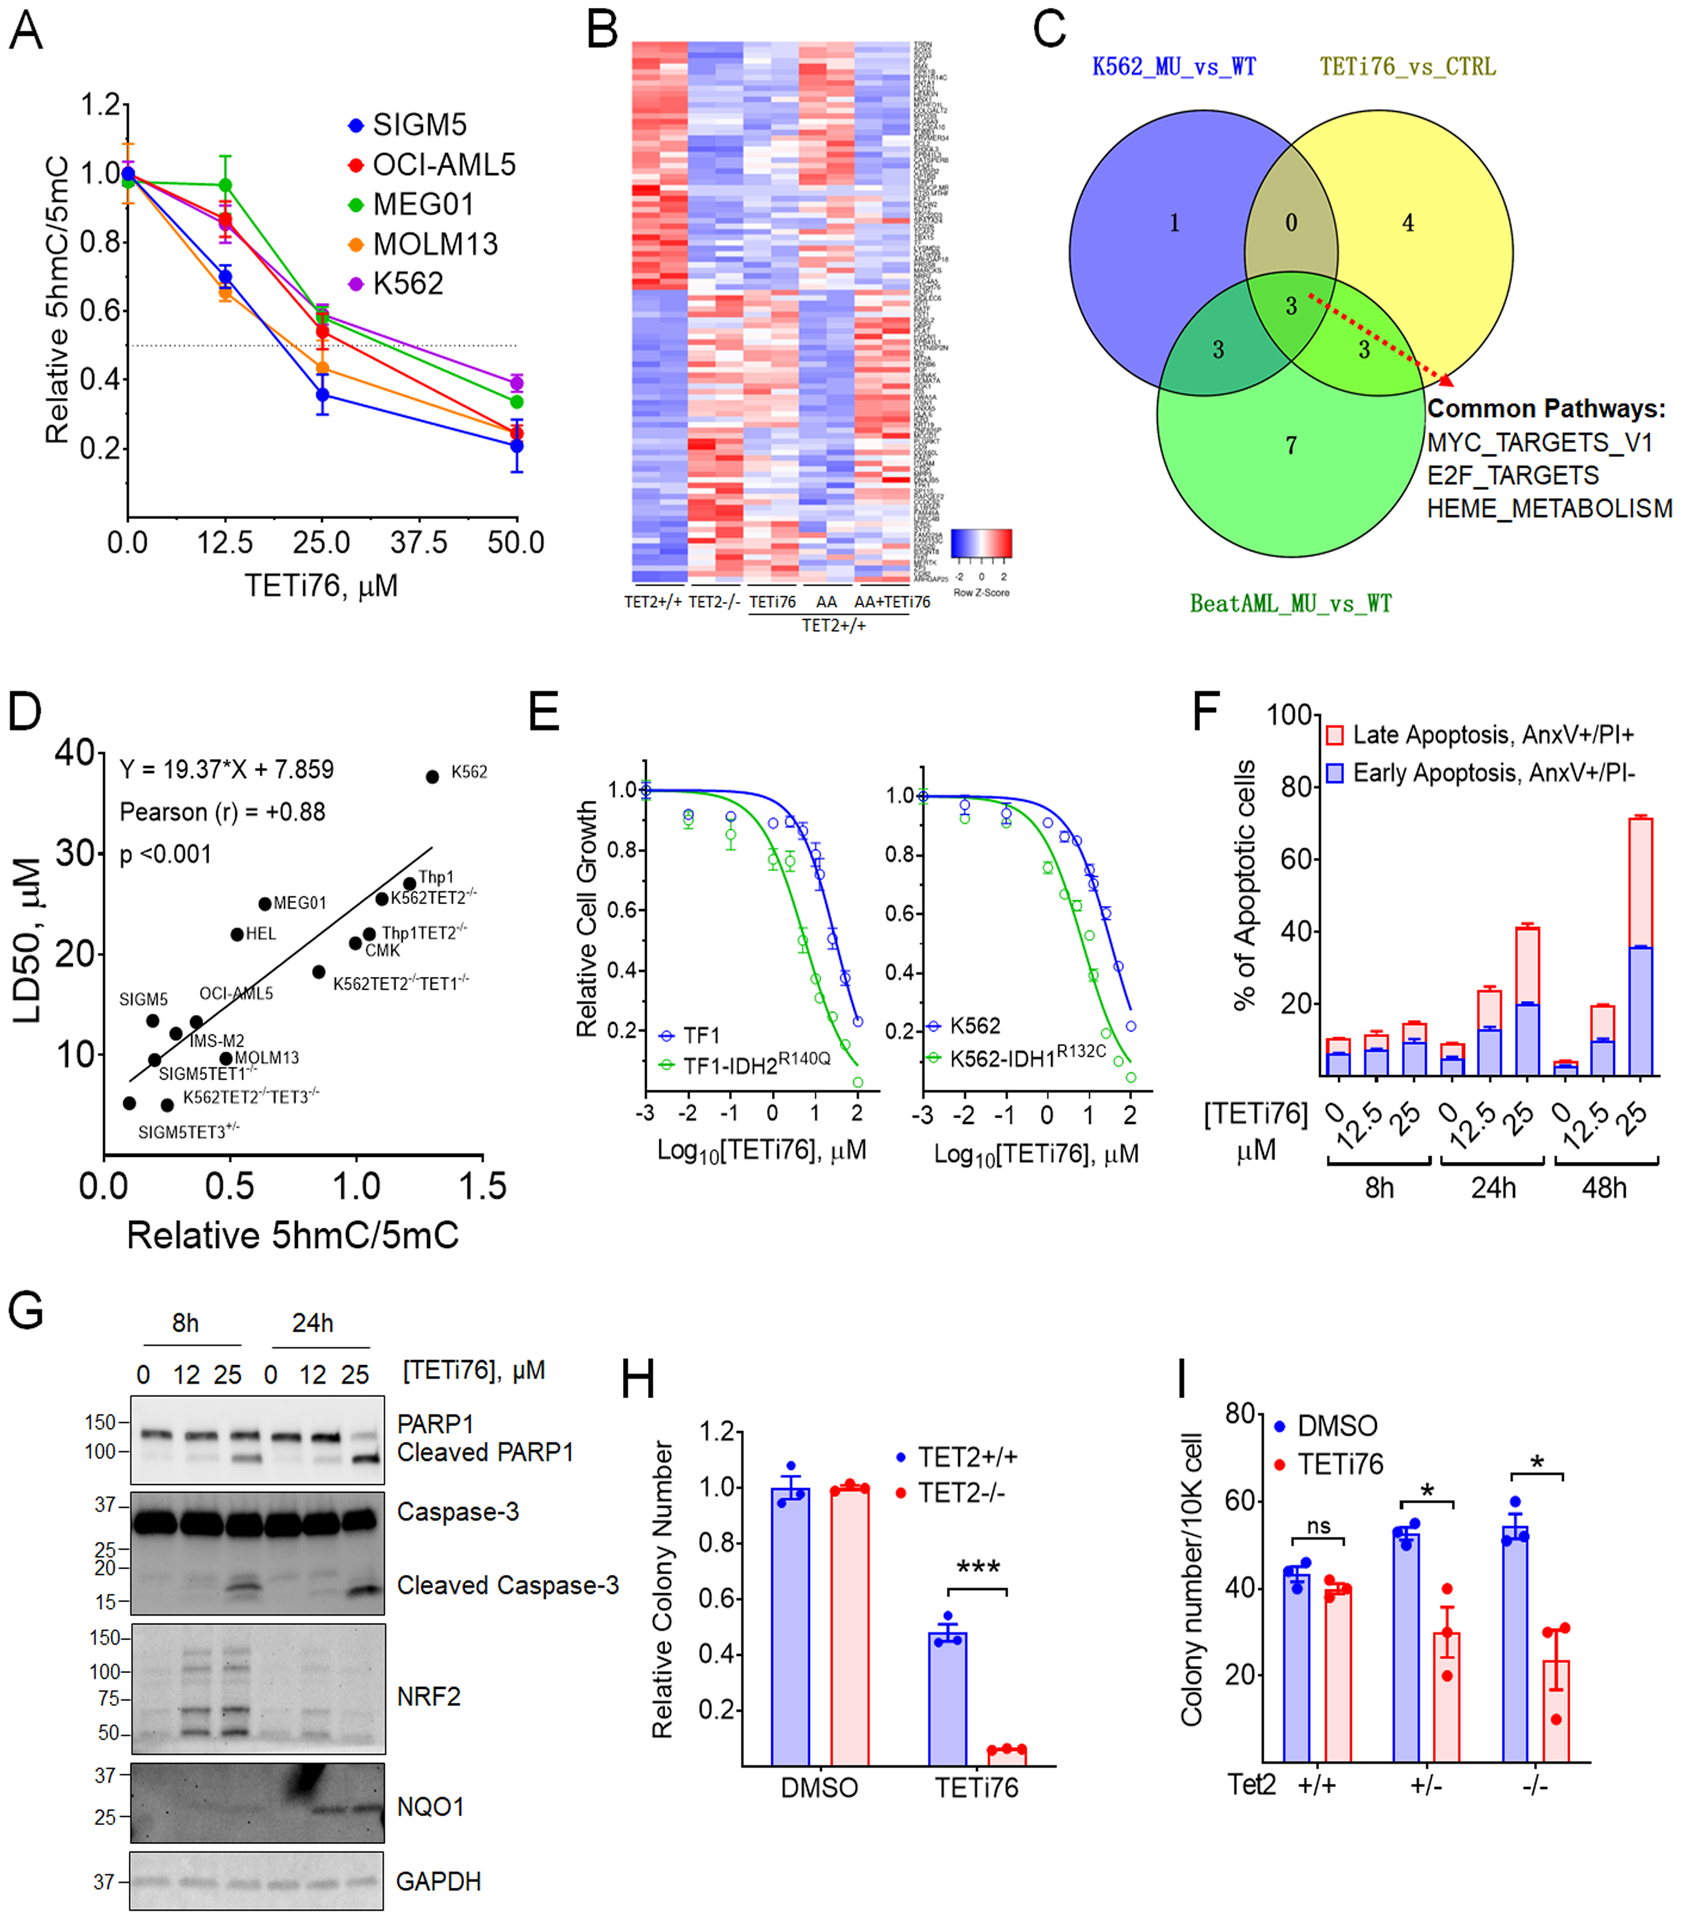
Figure 3. TETi76 mimics loss of TET activity and preferentially restricts the growth of TET-dioxygnease deficient neoplastic cells.

A, Dose dependent inhibition of 5hmC by TETi76 in different leukemia cells. Cells were treated with increasing concentrations of TETi76 in the presence of 100 μM sodium ascorbate for 12 hours. Genomic content of 5hmC and 5mC were detected by dot blot analysis using specific antibodies and the ratio of 5hmC/5mC are plotted. B, Heatmap of significantly up and down regulated genes in K562 TET2+/+ (K01) or K562 TET2−/− (K18) cells treated with 25 μM TETi76 or 100 μM ascorbic acid (AA) for 24 hours followed by RNAseq analysis. C, Venn diagram of pathway analysis of K562 TET2−/− (K18, MU) vs K562 TET2+/+ (K01, WT), K562 TET2+/+ (K01) treated with 25 μM TETi76 for 24 hours vs vehicle (DMSO) control (CTRL) or BeatAML RNAseq data of TET2 mutant (MU) vs TET2 wild type (WT) (vizome.org/aml/) performed by hallmark gene set enrichment analysis. D, Correlation Analysis of LD50 of TETi76 against different leukemia cells with TET-activity. The TET activities in different cells were measured by relative ratio of 5hmC/5mC in 15 different leukemia cell lines including 8 isogenic TET1/2/3 knockout cell lines. Each cell lines were treated with increasing concentrations of TETi76 for 72 hours and the LD50 was calculated from viable cell monitored by methylene blue exclusion on vi-cell counter. Pearson correlation coefficient (r) and significance were calculated in GraphPad Prism. E, Effect of TETi76 on cells expressing neomorphic IDH1/2 mutants. Commercially available TF1-IDH2R140Q, house-made K562-IDH1R132C (Fig. 1J) and their parental cells (TF1 and K562) were treated with different concentrations of TETi76 for 3 days. Both K562 and K562-IDH1R132C cells were supplied with 1 μg/ml doxycycline during TETi76 treatment. Relative cell growth was measured by CellTiter-Glo assay. F, TETi76 induces programmed cell death in TET2 deficient cells. SIGM5 cells were treated with TETi76 and the apoptotic cell population was determined by annexin V and propidium iodide staining using flow cytometer. TETi76 treatment demonstrate a dose and time dependent increase in early and late apoptotic cells. G, Western blot analysis of PARP1, Caspase-3, NRF2 and NQO1 after TETi76 treatment in SIGM5 cells. H, Colony forming abilities of K562 TET2+/+ and TET2−/− cells in the presence and absence of TETi76. I, Bone marrow from Tet2+/+, Tet2+/− and Tet2−/− mice were harvested and cultured in MethoCult in the presence or absence of TETi76. Data is representative of 3 independent experiments performed separately. Data are shown as mean or mean±SEM; statistical significance (p values) from two tailed t-test are indicated; * p<0.05; *** p<0.001; ns: not significant.
