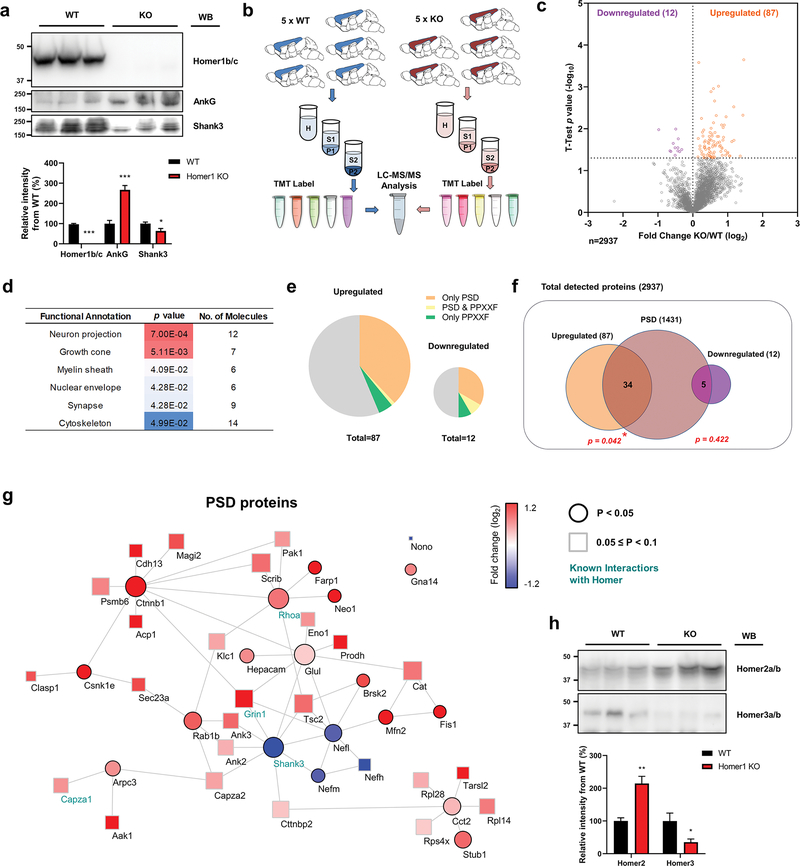
Fig. 5. The proteome is remodeled in the cortex of HOMER1 KO mice.
a. Levels of Homer1b/c (t(8) = 25.45), ankyrin-G (t(8) = 6.32), and Shank3 (t(8) = 2.54) proteins in P2 (crude synaptosomes) samples from the cortex of 3 weeks-old WT or HOMER1 KO mice. n = 5 per each group. *, p < 0.05; ***, p < 0.001; two-tailed Student’s t-test was performed. Data are represented as mean ± SEM. b. Scheme of experimental work-flow of the proteomic analysis. c. Volcano plot showing the fold change of individual protein levels versus significance between WT and HOMER1 KO mice. Significantly upregulated proteins are in orange (p < 0.05), significantly downregulated proteins are in purple (p < 0.05), and all other proteins are in gray. d. Gene ontology (GO) analysis of statistically overrepresented biological processes among the significantly differentially regulated proteins in HOMER1 KO mice. The analysis was performed from data in (c) by DAVID. e. Pie charts showing the presence in the PSD, inclusion of a PPXXF motif, or both, among the proteins significantly upregulated (left) and significantly downregulated (right) in HOMER1 KO versus WT mice. Gray indicates proteins that do belong to any of the categories. f. Diagram showing the number of either upregulated or downregulated proteins presents in the PSD. Significance was tested by hypergeometric tests. g. Cytoscape analysis of PSD proteins with altered levels coded by fold and significance of change. Circular nodes indicate p < 0.05 and rectangular nodes indicate 0.05 ≤ p < 0.1. Edges indicate predicted protein-protein interaction, including experimental data from the STRING database. The size of nodes indicates betweenness centrality. Previously known Homer1/2/3 interactors labeled in emerald. h. Levels of Homer2a/b (t(8) = 4.80) and Homer3a/b (t(8) = 2.49) proteins in P2 samples from the cortex of 3 weeks-old WT or HOMER1 KO mice. n = 5 per each group. *, p < 0.05; **, p < 0.01; two-tailed Student’s t-test was performed. Data are represented as mean ± SEM.

