
Fig. 4. SARS-CoV-2 superspreading events.
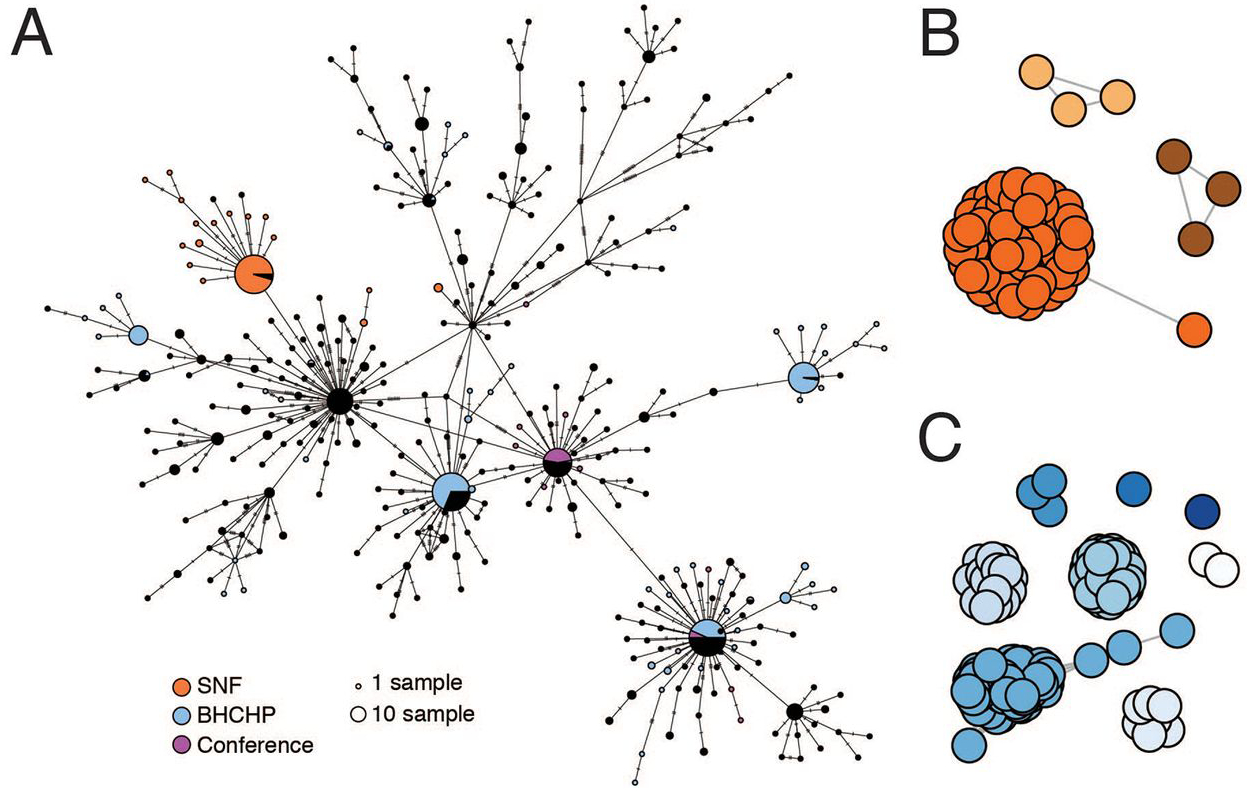
(A) Minimal spanning network showing genetic similarity of SARS-CoV-2 genomes in the MA dataset, with genomes from major known superspreading events highlighted. (B and C) Gene graphs showing clusters of highly similar sequences among viral genomes from the SNF (B) and BHCHP (C) cohorts. Sequences are clustered when they are separated by < 4 SNPs, and the lengths of lines between points reflect genetic distance.