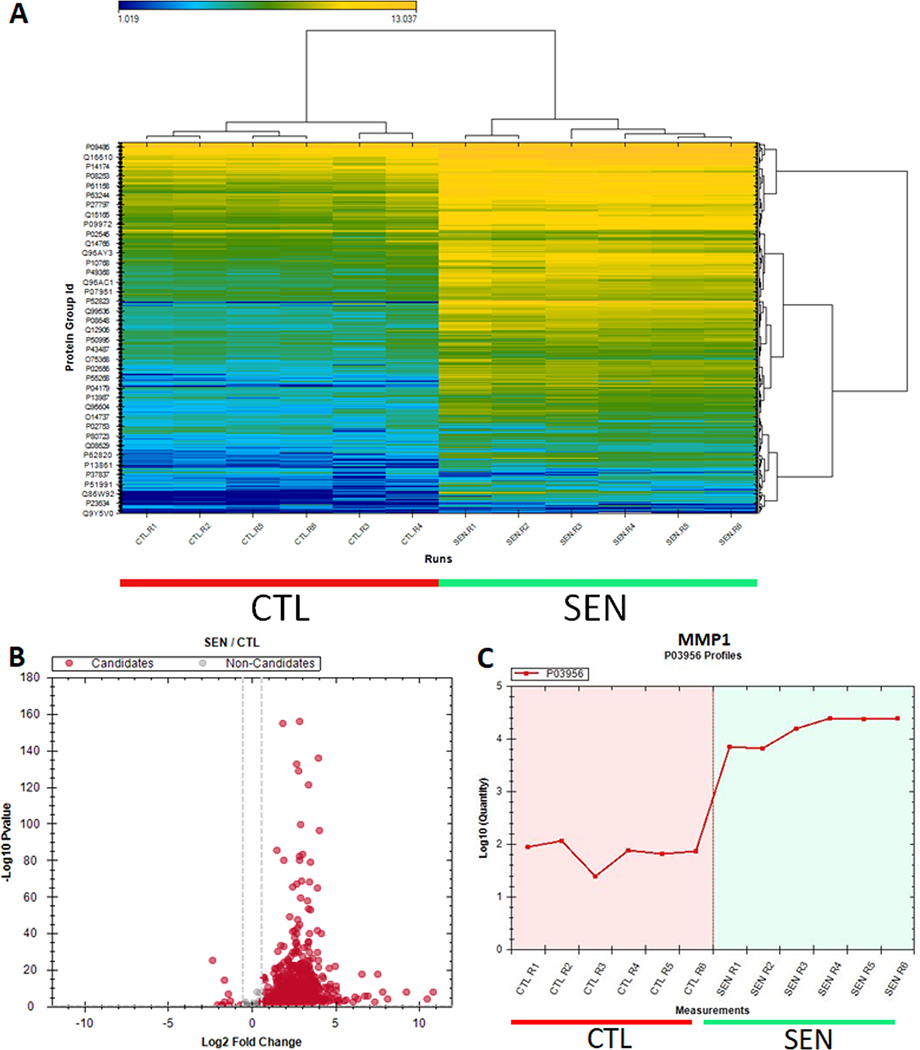
Figure 6.
SASP proteomic analysis figures generated by the Spectronaut software. A) Heatmap depicting the abundance of all proteins identified in the conditioned medium of oncogenic Ras-induced senescent (n=6) and control (n=6) IMR-90 cells. B) Volcano plot of the log2 fold changes in abundance of proteins secreted by senescent versus control cells. Red dots represent fold changes greater than 1.5-fold, and p-values less than 0.05. C) Line plot showing the abundance of a classical SASP protein, MMP1, in the secretomes of senescent and non-senescent cells.

