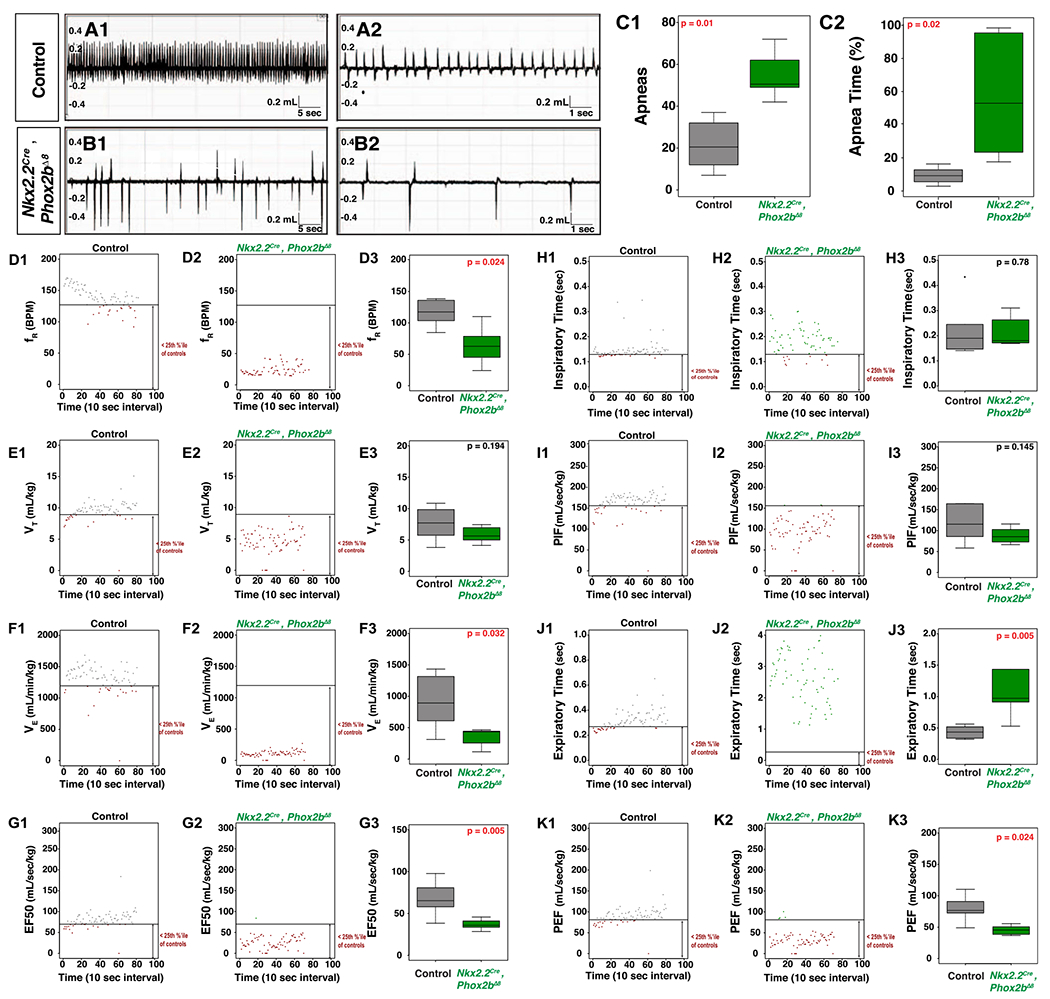
Figure 2. Respiratory Physiology in newborn Nkx2.2cre, Phox2bΔ8 pups.

A and B. Wave forms obtained from head out plethysmography configuration. Genotype designated on left. A1 and B1 are 1-minute-long traces demonstrating the marked differences in respiratory frequency between control and Nkx2.2Cre, Phox2bΔ8 mice. A2 and B2 are 16-second-long breathing traces demonstrated the waveforms of each breath for control and Nkx2.2Cre, Phox2bΔ8 mice. C1 and C2 show the number and duration of apneas, respectively. Analysis of respiratory patterns is shown as follows: D1-D3 show frequency (fR), E1-E3 show tidal volume (VT), F1-F3 show minute ventilation (VE), G1-G3 show EF50, H1-H3 show inspiratory time (Ti), I1-I3 show peak inspiratory flow (PIF), J1-J3 show Expiratory time (Te), and K1-K3 show peak expiratory flow. In each series, an example animal is plotted for each genotype. Each plot shows a line that represents the 25th percentile of pooled control data, with each data point lying out of the 25th percentile colored in red (note the significant number of red data points in the mutants). Box-whisker plots show the median as the bar, the box is the interquartile range, and the whiskers are 1.5 times the interquartile range. Control is in gray, Nkx2.2Cre, Phox2bΔ8 is green. Corrected P-values are shown in the top right of each boxplot, with red indicating tests with statistical significance. Nkx2.2Cre, Phox2bΔ8 show significantly decreased frequency, minute ventilation, EF50, peak expiratory time and an increased expiratory time. n = 6 control, n = 6 Nkx2.2cre, Phox2bΔ8 mice obtained from two distinct litters for these analyses.
