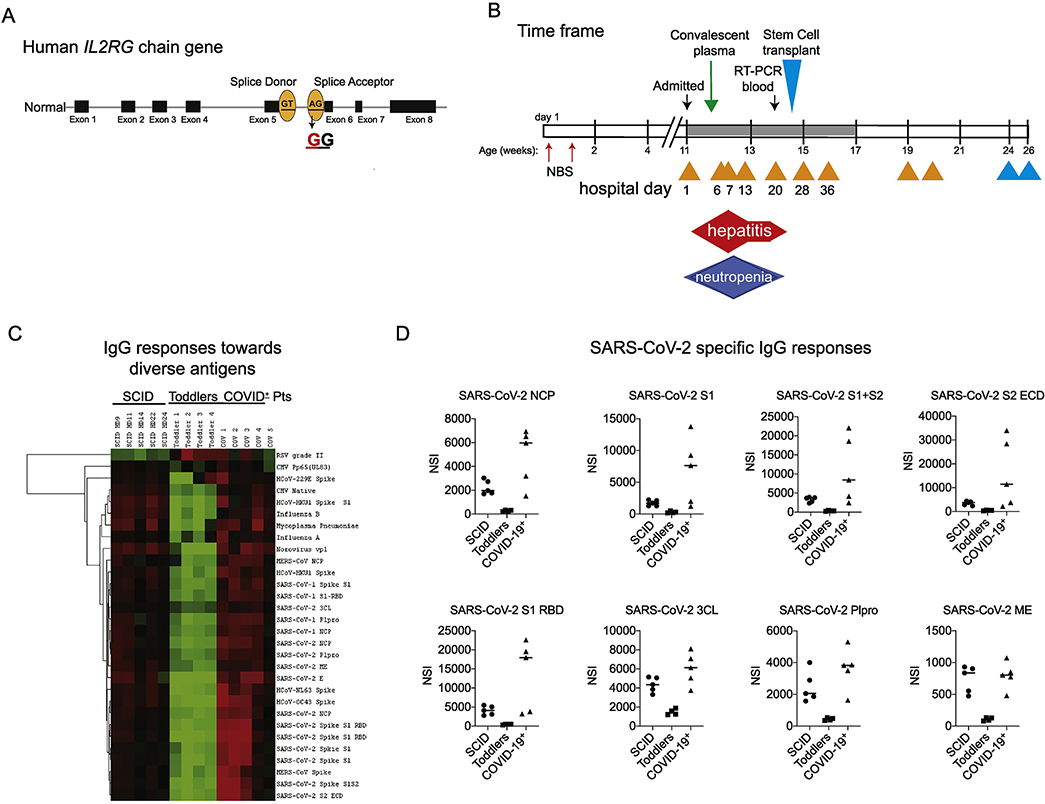
Figure 1.
A. IL2RG gene map with patient’s mutation at the intron 5 splice acceptor. B. Time course of events throughout the patient’s life. Grey filled horizontal bar represents the hospitalization. Small yellow triangles represent positive RT-PCR tests for SARS-CoV-2. Small blue triangles indicate negative tests. C. Heatmap of IgG binding activity in patient serum at various timepoints after convalescent plasma, in samples from non-SARS-CoV-2 infected infants, and COVID-19 patients from a patient registry. D. Relative IgG binding activity for SARS-CoV-2 spike proteins S1 and S2, RBD, NCP as well as S2 extracellular domain (ECD), 3CL and Papain-like proteases (Plpro), and M and Envelope proteins. Y axes represent net signal intensity (NSI) in which background staining is subtracted from each sample.

