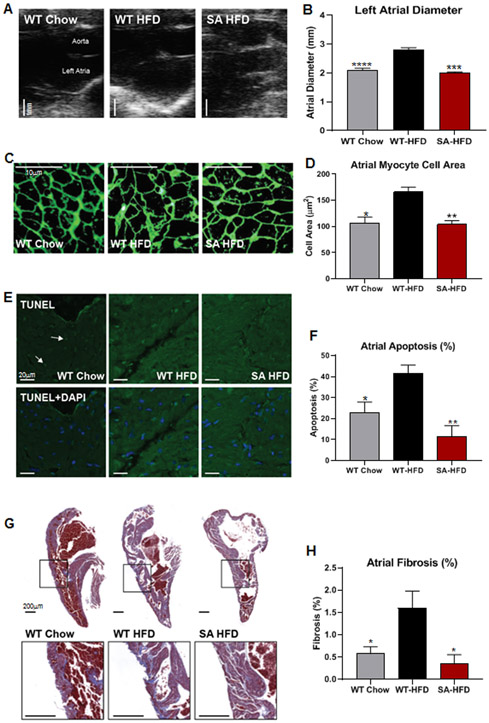
Figure 3. SA knock-in mouse model is resistant to high-fat diet induced cardiac remodeling.
(A) Representative echocardiograms (Scale bar 1 mm) and (B) quantification of left atrial diameters. Data are presented as means ± SEM (WT Chow n=15, WT-HFD n=15, SA-HFD n=4; ***p<0.001, ****p<0.0001 vs WT-HFD). (C) Left atrial section cell membranes stained with Wheat germ agglutinin (Scale bar 10μm) and (D) Cross sectional areas measured from atrial cells to determine cell areas changes. Data are presented as means ± SEM (n=3/group; *p<0.05, **p<0.01 vs WT-HFD). (E) TUNEL staining of left atrial sections to determine apoptosis (Green hot spots=nuclei with DNA fragmentation due to apoptosis; Arrows= toward hot spots; DAPI stain=location of all nuclei) (Scale bar 20μm) and (F) Percentage of cells undergoing apoptosis. Data are presented as means ± SEM (WT Chow n=4, WT-HFD n=4; SA-HFD n=3; *p<0.05, **p<0.01 vs WT-HFD). (G) Masson’s Trichrome staining of Left atrial sections to indicate fibrosis (blue) levels relative to normal cardiac tissue (red) (Scale bar 200μm) and (H) Percentage of fibrotic tissue. Data are presented as means ± SEM (WT Chow n=6, WT-HFD n=6; SA-HFD n=4; *p<0.05 vs WT-HFD).

