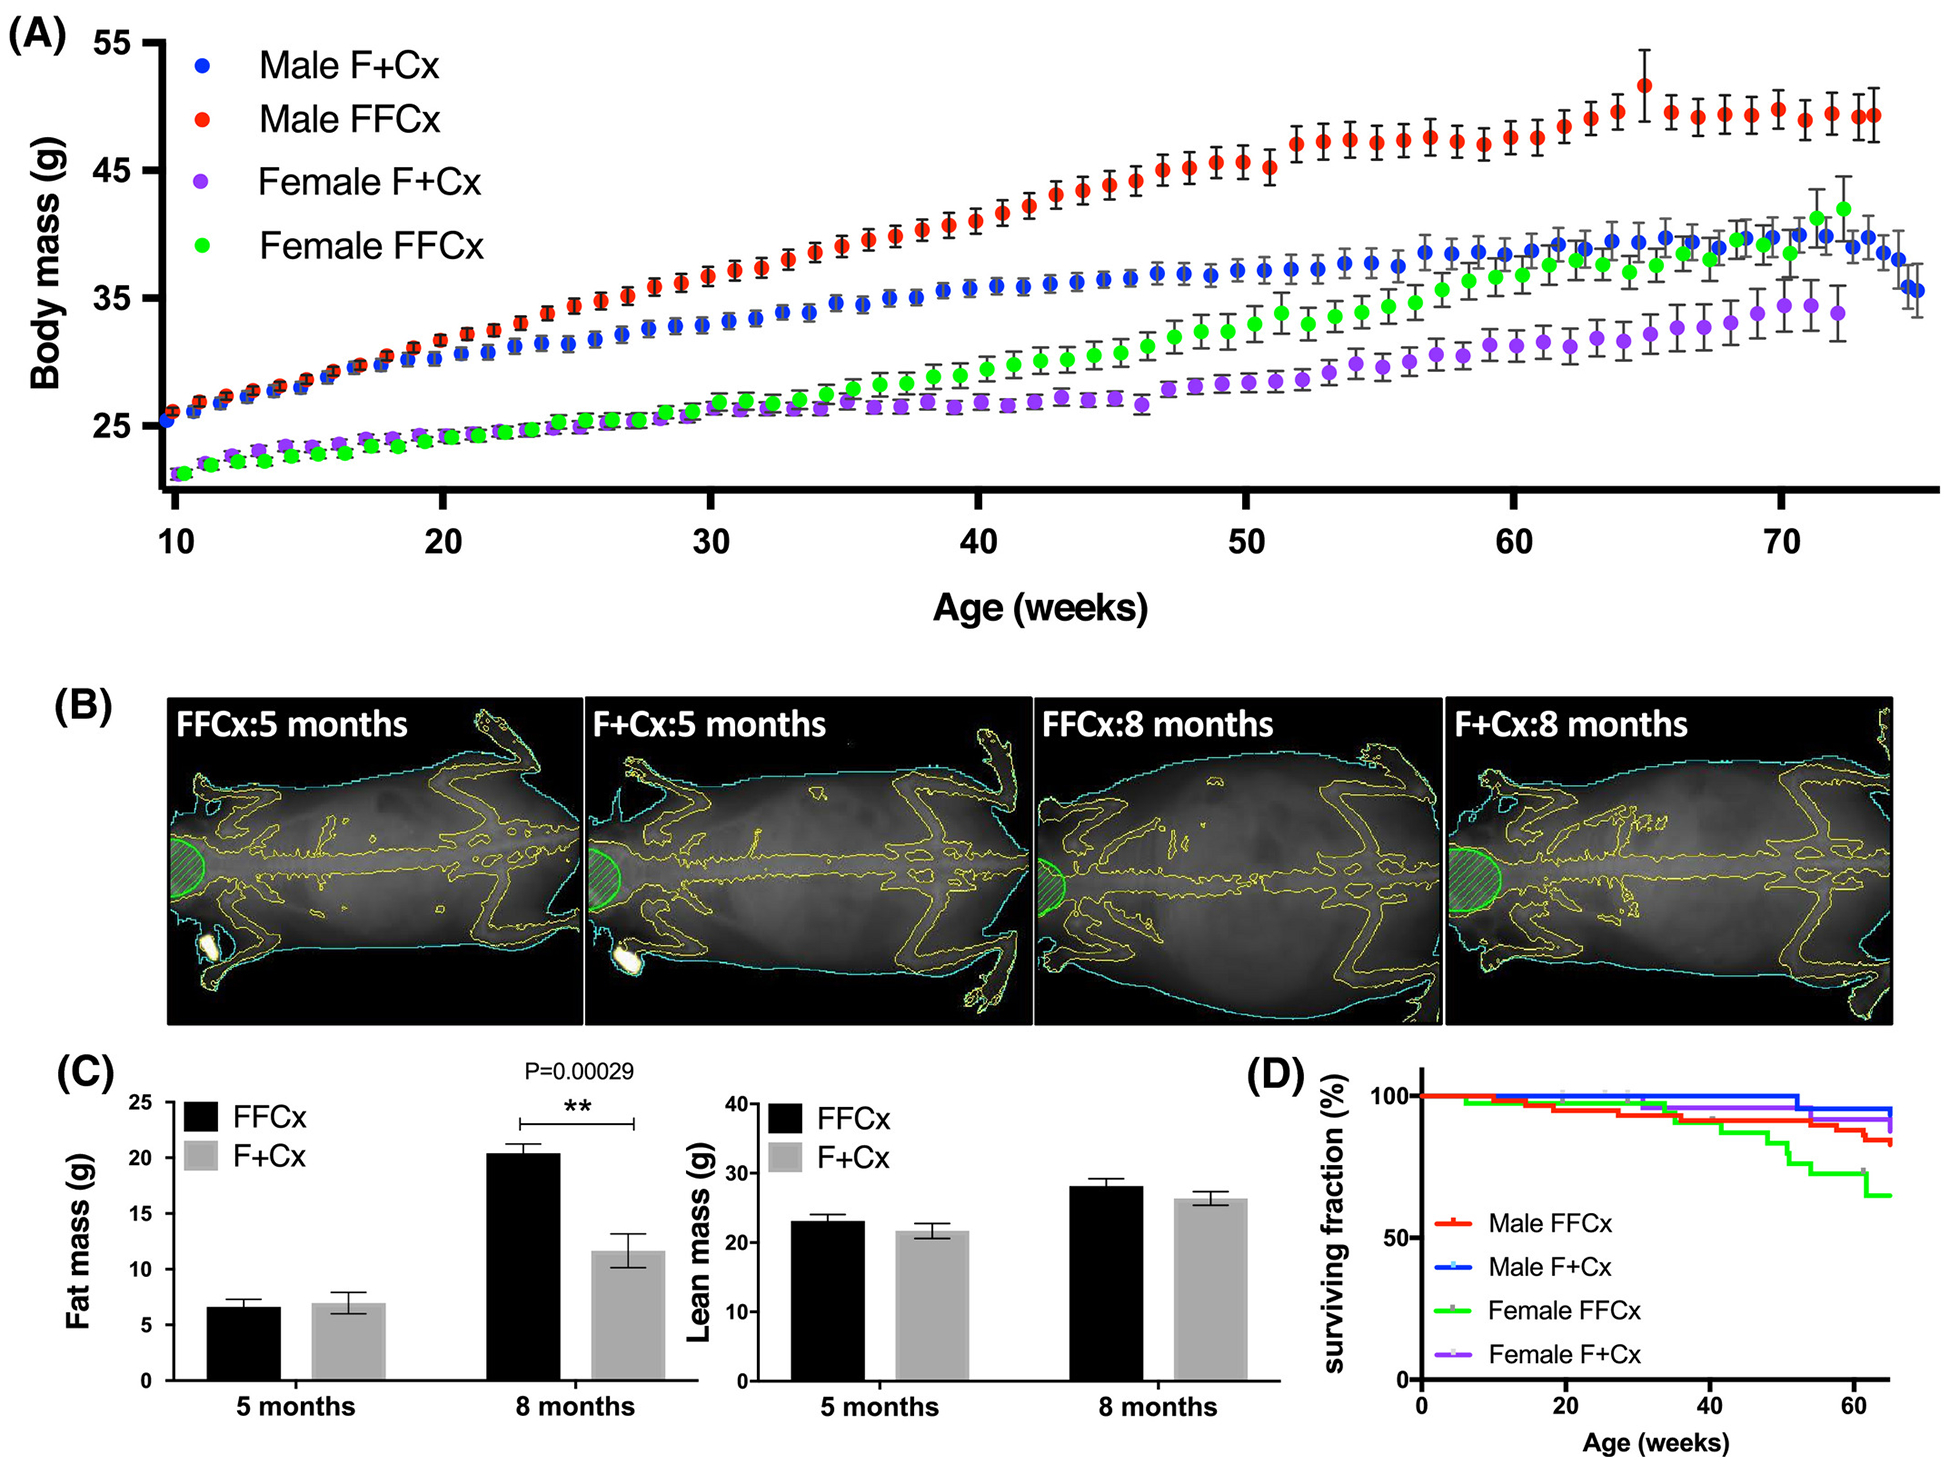
Figure 3.

Obesity in experimental mice upon SDHC loss in TH+ cells. A. Body weight over 78 wk. Numbers of mice for each genotype were: 36 FFCx and 30 F+Cx males; 28 FFCx and 30 F+Cx females. B. X-ray imaging of representative mice at 20 (pre-obese) and 32 (obese) wk using densitometry with dual energy X-ray absorptiometry (DEXA) in a Lunar PIXImus scanner. C. Fat and lean mass for 7 experimental and 7 control mice at 20 and 32 wk. D. Survival of mice represented in panel A. Statistical analyses were performed using Prism 8 with bars indicating mean ± SD. Fat and lean mass data were analyzed by 2-way ANOVA with Tukey’s correction test over genotype and time.
