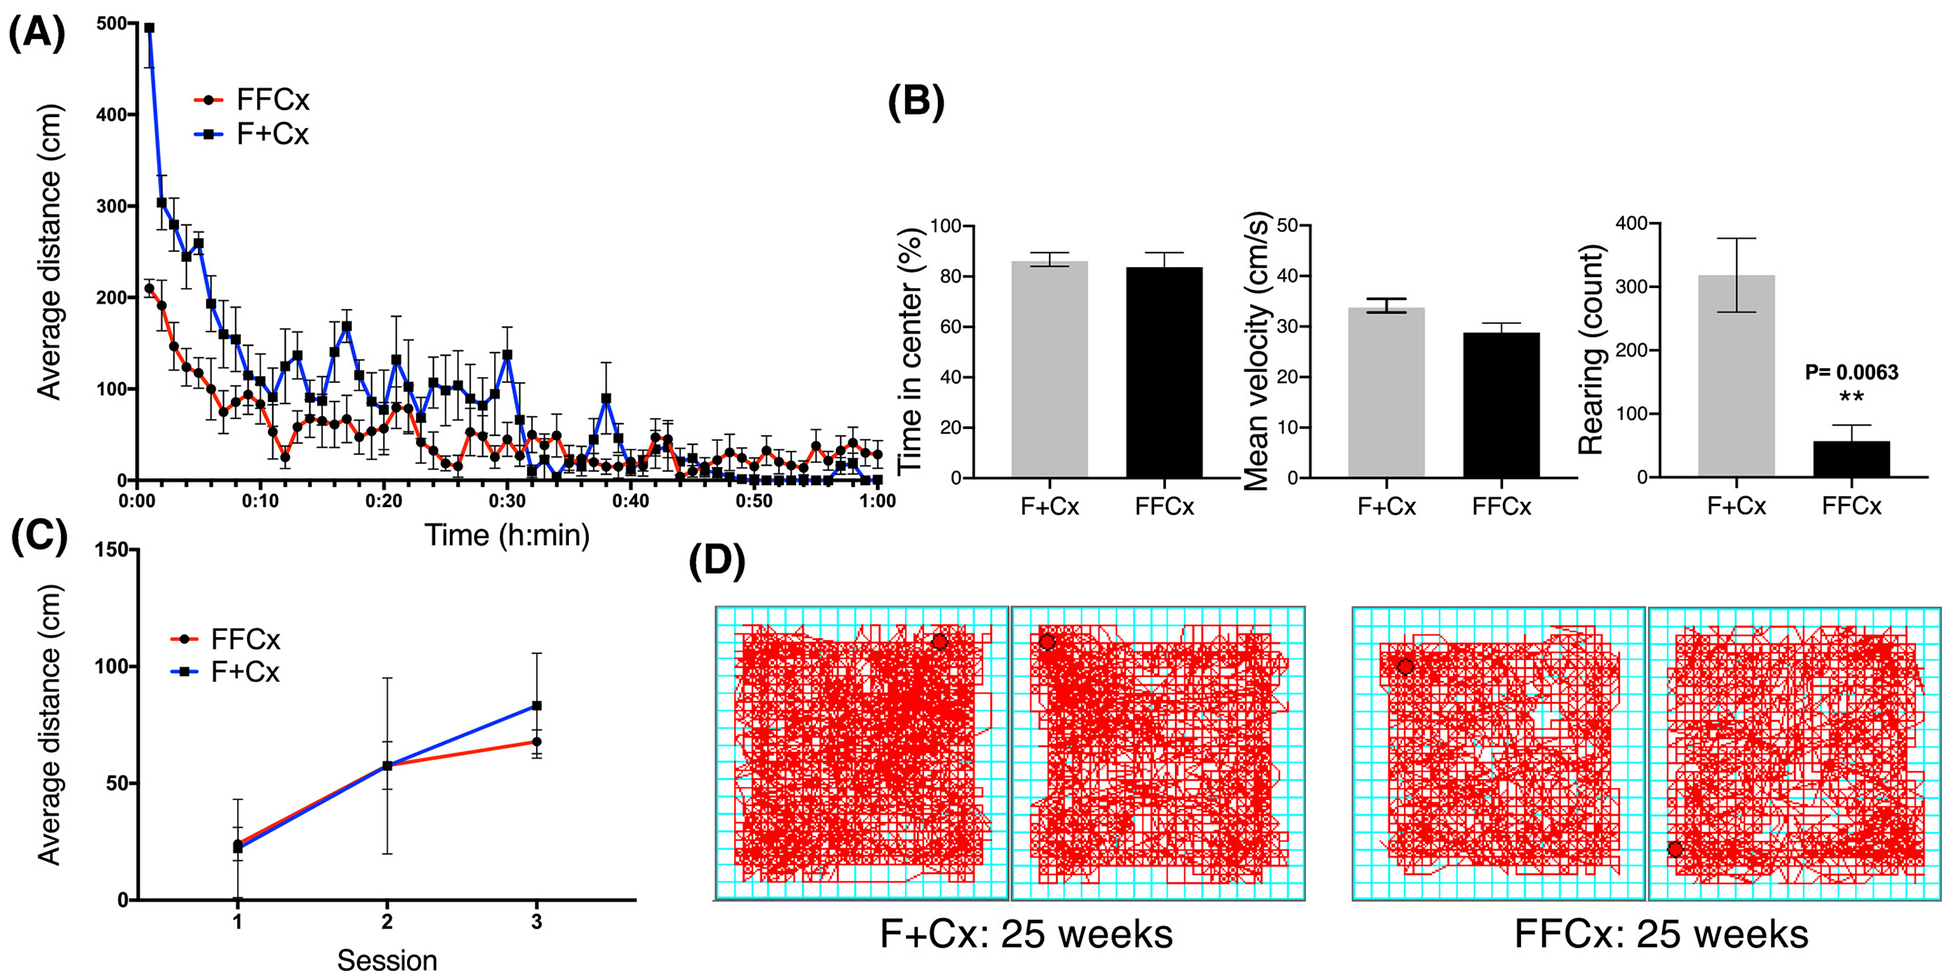
Figure 4.

Assessment of behavior and locomotor activity in open field test for male mice of the indicated genotypes at 24 wk. Data are for representative control and experimental pairs habituated in the chamber for 3 consecutive d in 60-min sessions during daylight. A. Distance traveled by habituated mice during third session. B. Percentage of time spent in the center, mean velocity, and rearing behavior in habituated mice over 1 h. C. Average distance traveled distance over all 3 d of testing. D. Representative motion tracings for mice of the indicated genotypes. Average distance traveled during a 60-min session, time in the center, mean velocity and rearing count were analyzed using a Student’s t-test. Average distance across 3 sessions was analyzed using 2-way ANOVA followed by Tukey’s correction test. Bars represent mean ± SE. 14 animals of each genotype were used to complete this test.
