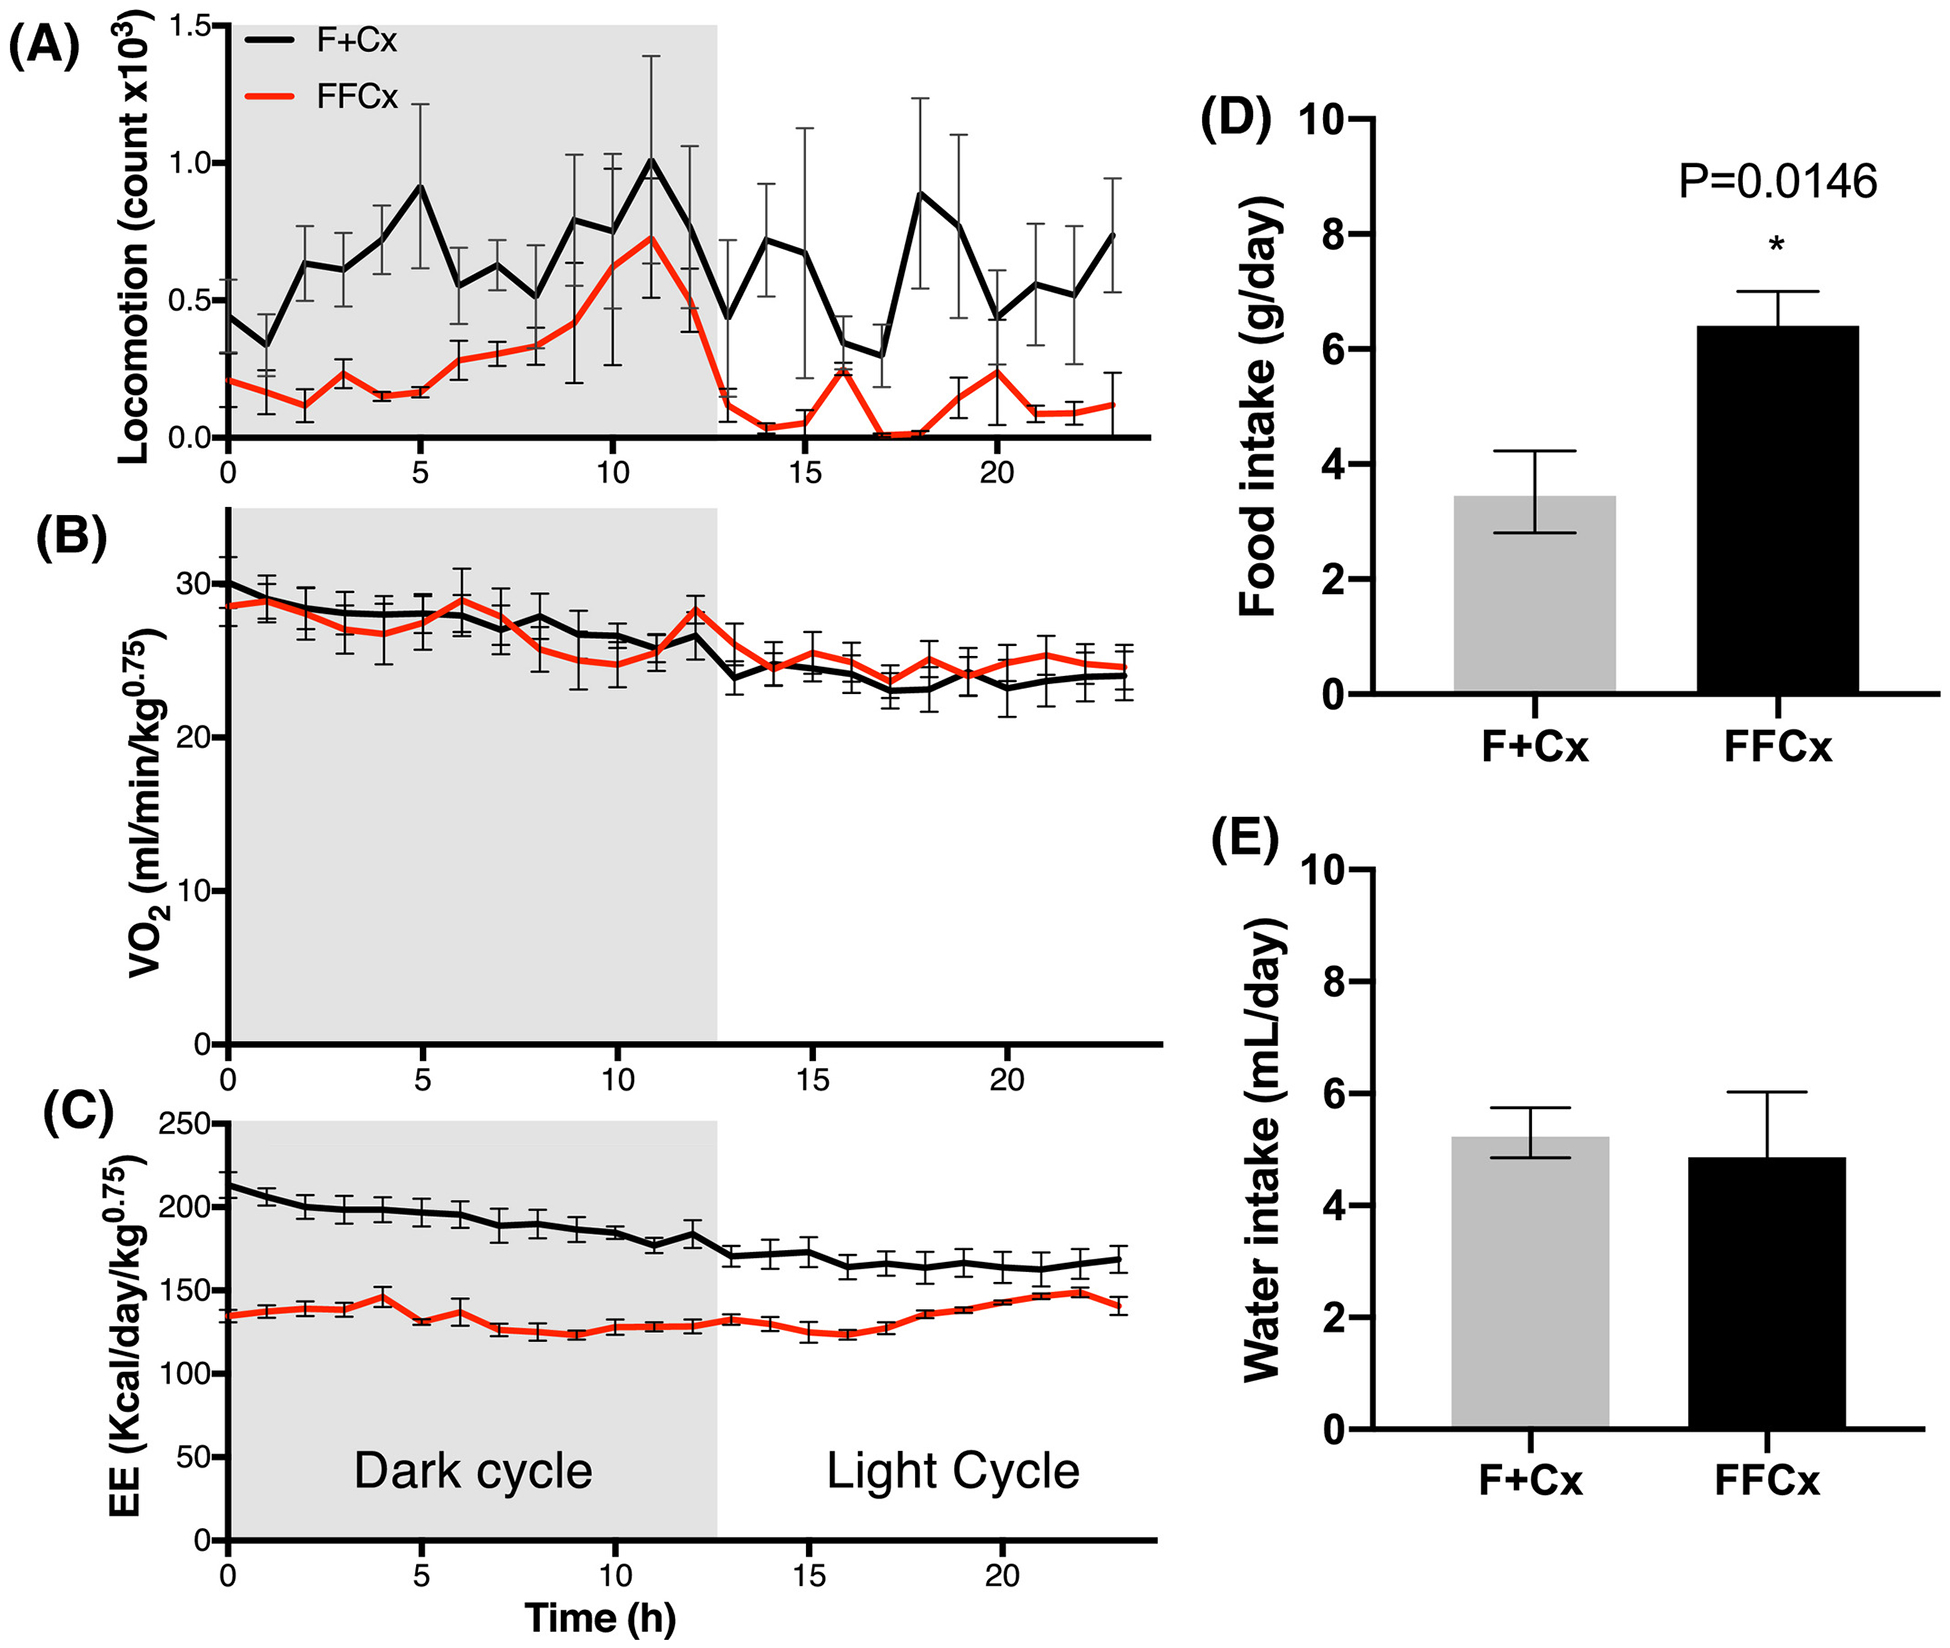
Figure 5.

Metabolic energy profile and dietary intake for male mice at 24 wk. Experimental (FFCx) mice were placed in a metabolic cage and compared with control littermates in another cage for each trial over one d with the indicated dark/light cycle. A. Locomotion activity (arbitrary units). B. Normalized oxygen consumption rate. C. Energy expenditure. Food intake (D) and water intake (E) were also measured over 24 h. Statistical analysis was by Student’s t-test, with only P-values expressing significance below 0.05 being reported. Bars represent mean ± SE. Numbers of animals used for each genotype: FFCx (14) and F+Cx (14).
