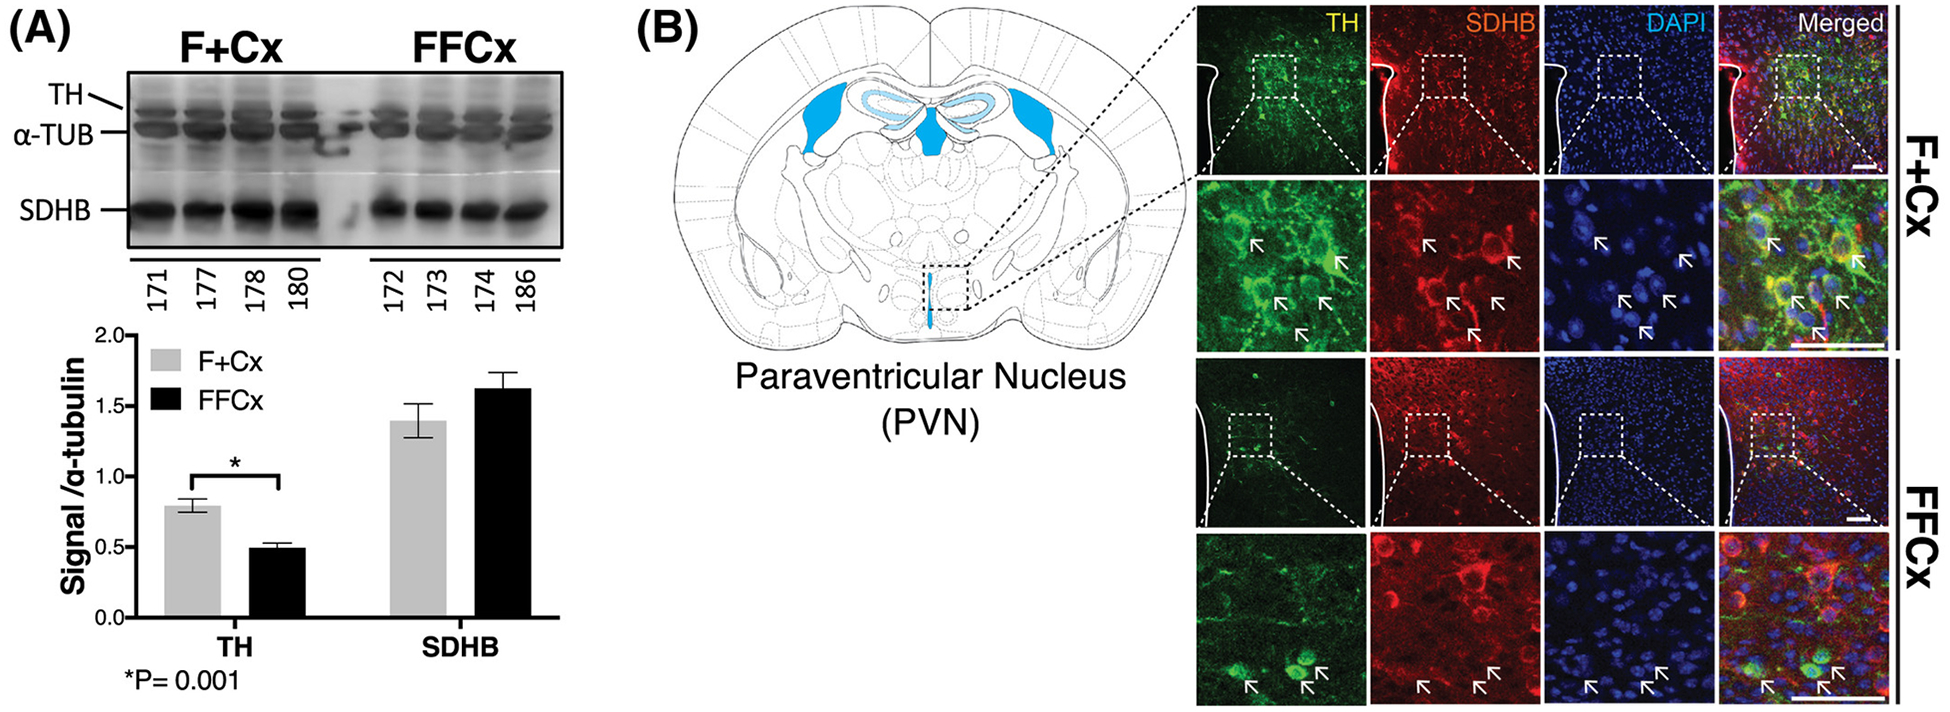
Figure 6.

Changes in TH+ cells in key regions of the hypothalamus important for feeding behavior. A. Western blot analysis of TH and SDH (represented by SDHB) in hypothalamic preoptic tissue for the indicated 4 representative animals. Western blot signal quantitation statistics were analyzed using a Student’s t-test with bars indicating mean ± sd. B. Fluorescent immunohistochemical staining analysis of the PVN monitoring TH (green), SDHB (red) and DAPI (blue) Arrows indicate example cells showing contrasting features. Scale bar: 50 μm.
