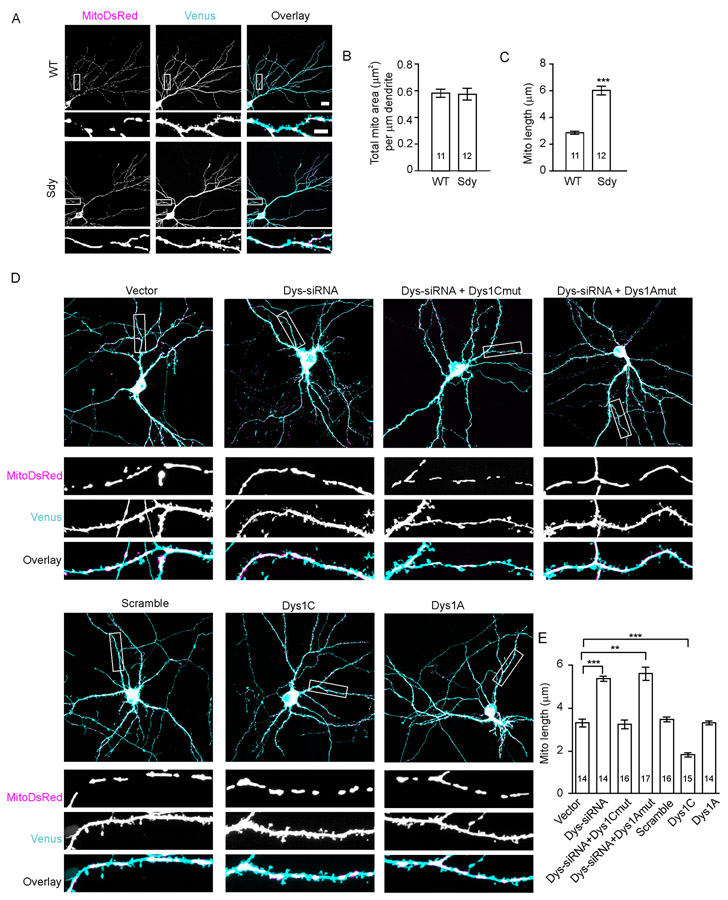
Fig. 1. Dysbindin-1 controls mitochondrial length.
Hippocampal slices cultured from sdy mice and their WT littermates (A–C) or cultured WT hippocampal neurons (D, E), were used for confocal imaging of mitochondria. (A) Representative images of mitochondria in the CA3 region; scale bar, 10 μm. (B, C) Quantification for A; Mann-Whitney U Test (B) and Student’s t-test (C) were used; n in the bars indicates the number of brain slices from 4 WT and 5 sdy mice. (D) Representative images of transfected neurons; scale bar, 20 μm for upper and 5 μm for lower, enlarged images. (E) Quantification for D; one way ANOVA on ranks was used to compare across groups (H = 82.78, DF = 6, p < 0.001); Student’s t-test was used for vector vs. Dys-siRNA, vector vs. Dys-siRNA + Dys1C-mut, vector vs. Dys-siRNA + Dys1A-mut; Mann-Whitney U test was for vector vs. scrambled, vector vs. Dys1C, vector vs. Dys1A; n in the bars indicates the number of neurons. Data are presented as mean ± SEM. ** p < 0.01, *** p < 0.001.

