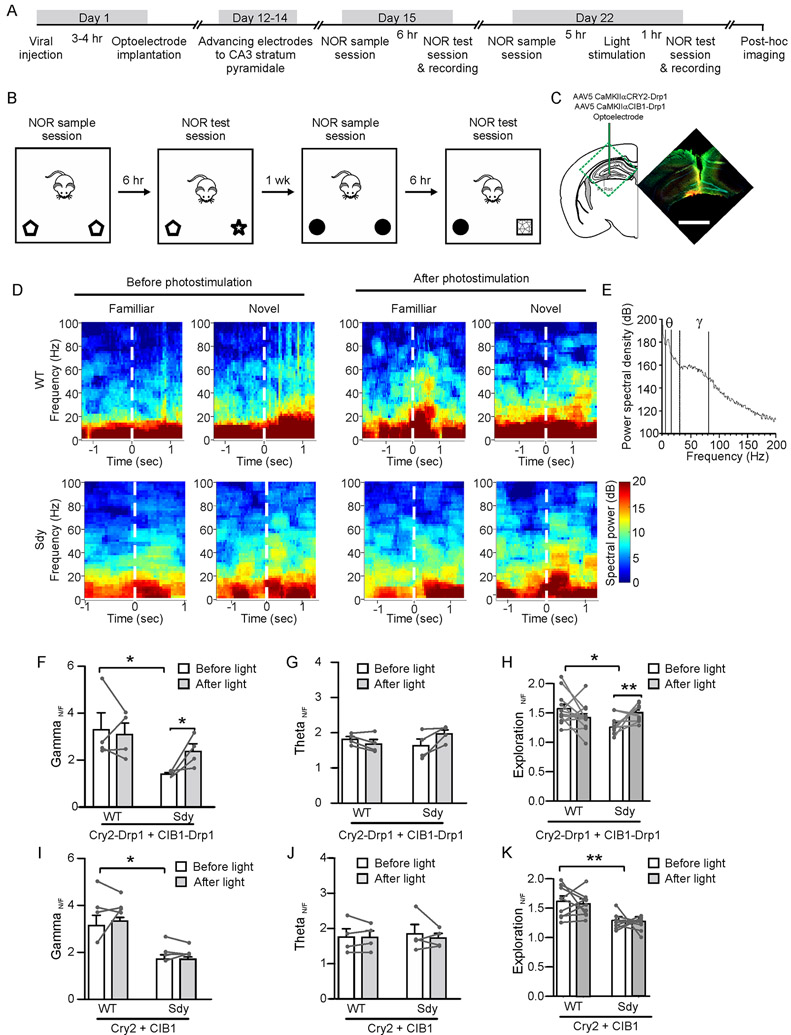
Fig. 8. Light-induced mitochondrial fission rescues in vivo gamma oscillations and novel object recognition (NOR) in sdy mice.
5-week-old sdy mice and their WT littermates were injected with virus and implanted with optoelectrodes or optic fibers in the CA3 region, and then subjected to in vivo recording and the NOR test. (A) Experimental schedule. (B) NOR test protocol. (C) The site of viral injection and placement of optoelectrode. The image shows the expression of Cry2-Drp1 (red), CIB1-Drp1 (green), and DAPI staining (Cyan) at the injection site; scale bar, 1 mm. (D) The histogram shows the power spectral density (PSD) of LFPs vs. frequencies. The four inflection points at 6, 15, 30, 80 Hz as indicated by the dash lines were used to define the gamma and the theta range. (E) Time-frequency spectrogram of LFP oscillations before and after object exploration during the test session of NOR in mice injected with Cry2-Drp1 and CIB1-Drp1 viruses. The dashed line indicates the time when the mouse started the exploration. (F, G) Ratio of the gamma-range integrated power spectral density during novel object exploration to that during familiar object exploration (Gamma N/F) before and after light stimulation. (H, I) Ratio of the theta-range integrated power spectral density during novel object exploration to that during familiar object exploration (Theta N/F) before and after light stimulation. (J, K) Ratio of time exploring the novel object to that exploring the familiar object (Exploration N/F) before and after light stimulation. Student’s t-test was used to compare sdy vs. WT and paired Student’s t-test was used to compare before vs. after light stimulation. Data are presented as mean ± SEM; n in the bars indicates the number of mice; * p < 0.05, **p < 0.01.

