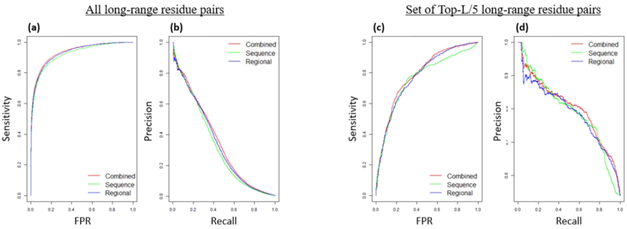
Figure 3.
Prediction performance curves of the sequence attention model, regional attention model, and combined model. (a) ROC curve for all long-range contact predictions. (b) Precision-Recall curve for all long-range contact predictions. (c) ROC curve for all residue pairs that appear in the union of residue pairs from top-L/5 scores in any of the three models. (d) Precision-Recall curve for all residue pairs that appear in the top-L/5 scores in any of the three models.

