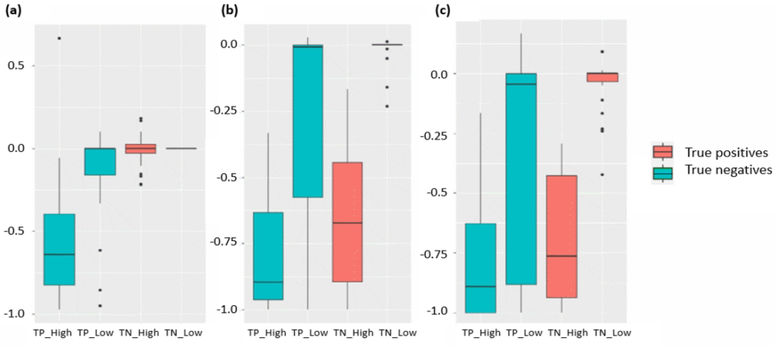
Figure 7.
Performance after permutation of different locations of the input. The Y-axis indicates the increase or decrease of top-L/5 precision scores after permutation. Here we choose locations that have the highest and lowest k attention scores as centers for permutated regions, where k is the number of true positives of each target. (a) Impact of permutated regions with size (1,1). (b) Impact of permutated regions with size (3,3). (c) Impact of permutated regions with size (5,5). TP_High: true positive predictions with high scores. TP_Low: true positive predictions with low scores. TN_High: true negative predictions with high scores. TP_Low: true negative predictions with low scores.

