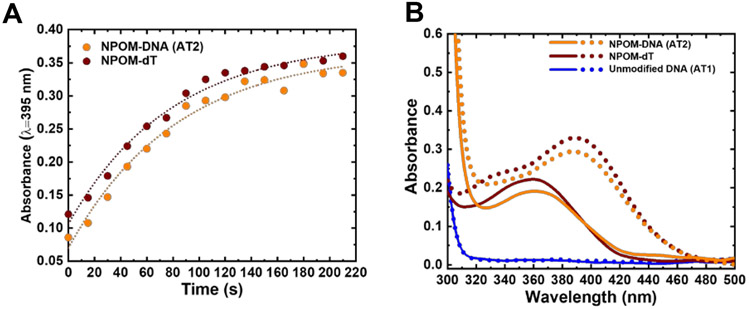
Figure 2. Dose-dependent photocleavage of NPOM from DNA as monitored in situ by UV-visible absorption spectroscopy.
(A) Absorption at 395 nm versus time for NPOM-DNA (AT2, orange) and NPOM-dT nucleoside (brown). Dotted lines indicate single exponential fitting of the data (see also Figures S1 and S2). (B) Absorption spectra of NPOM-DNA (AT2, orange), NPOM-dT (brown), and unmodified DNA duplex (AT1, blue) before (solid line) and after 120 s of light irradiation (dotted line).

