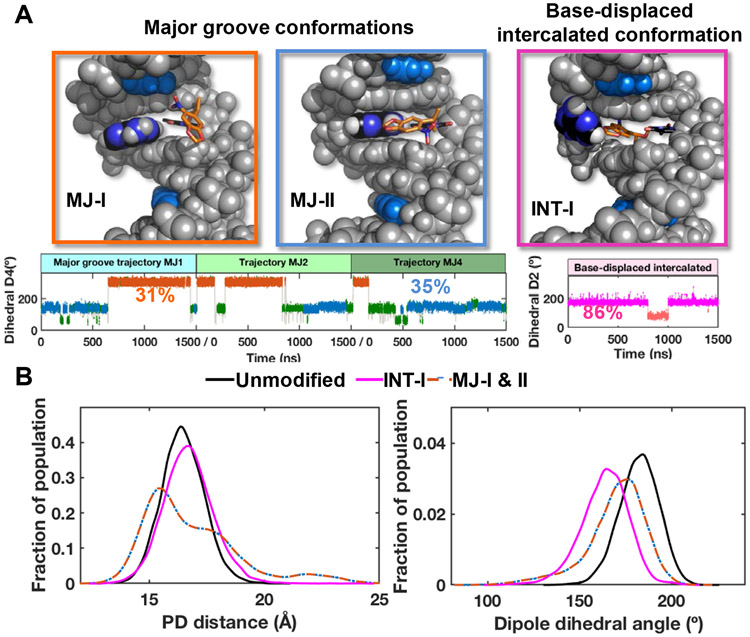
Figure 6. NPOM-containing DNA structures obtained from stable MD derived ensembles.
(A) Best representative structures for the two major groove (MJ) and one base-displaced intercalated (INT) conformations. The NPOM-dT dihedral angles (Figure S16) that determine these different conformations are shown for each conformational family (MJ and INT) with each cluster color-coded and labeled with its percentage of population. The transient clusters in the major groove ensembles are colored green. These structures are shown in cartoon in Figure S15. (B) The distributions of the modeled FRET pair distances (PD distance) and dipole dihedral angles for the major groove and base-displaced intercalated NPOM-dT-containing DNA and unmodified DNA. The definitions for the PD distance and dipole dihedral angle are given in Figure S17. The major groove values are for the two dominant major groove conformations (MJ-I and MJ-II, 66% of the population), and the base-displaced intercalated values are for the stable intercalated conformation (INT-I, 86% of the population).

