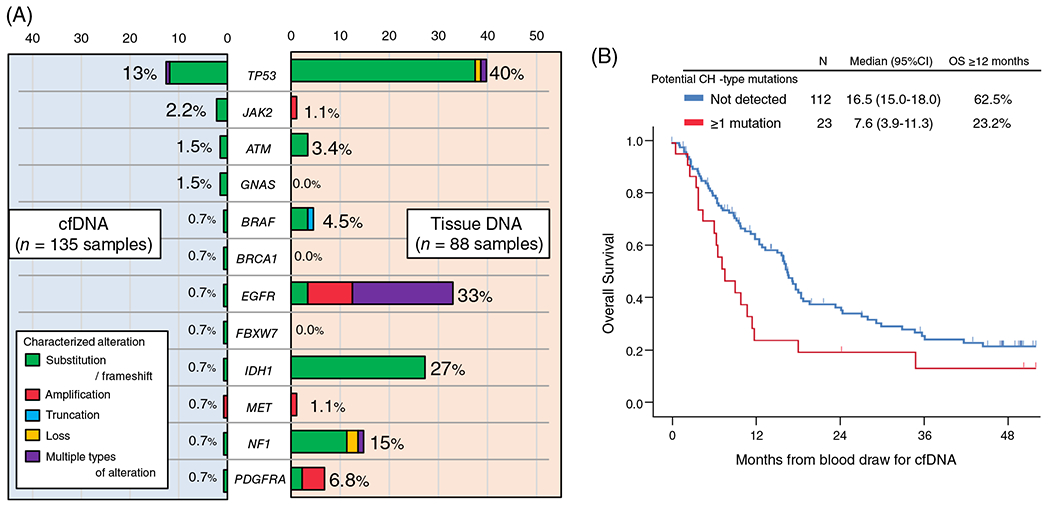
FIGURE 2.

A, Detection rate (percentage of patients) of characterized genomic alterations among patients with brain gliomas. cfDNA analysis was performed in 135 patients while tissue-DNA was performed in 88 patients. Characterized cfDNA alterations occurred in these 12 genes. The loci altered may not be the same in the cfDNA and tissue, even if the gene is the same (Table S3). B, Kaplan-Meier curve for overall survival (OS) from cfDNA blood test depending on the presence of potential CH-type mutations in cfDNA among patients with brain gliomas (N = 135). cfDNA, cell-free DNA; CH, clonal hematopoiesis; CI, confidence interval; HR, hazard ratio; OS, overall survival
