Abstract
Background:
The large-scale social distancing efforts to reduce SARS-CoV-2 transmission have dramatically changed human behaviors associated with traumatic injuries. Trauma centers have reported decreases in trauma volume, paralleled by changes in injury mechanisms. We aimed to quantify changes in trauma epidemiology at an urban level 1 trauma center in a county that instituted one of the earliest shelter-in-place orders, to inform trauma care during future pandemic responses.
Methods:
A single-center interrupted time-series analysis was performed to identify associations of shelter-in-place with trauma volume, injury mechanisms, and patient demographics in San Francisco, California. To control for short-term trends in trauma epidemiology, weekly level data were analyzed six months before shelter-in-place. To control for long-term trends, monthly level data were analyzed five years before shelter-in-place.
Results:
Trauma volume decreased by 50% in the week following shelter-in-place (p<0.01), followed by a linear increase each successive week (p<0.01). Despite this, trauma volume for each month (March-June 2020) remained lower compared to corresponding months for all previous five years (2015-2019). Pediatric trauma volume showed similar trends with initial decreases (p=0.02) followed by steady increases (p=0.05). Reductions in trauma volumes were due entirely to changes in non-violent injury mechanisms, while violence-related injury mechanisms remained unchanged (p<0.01).
Conclusion:
Although the shelter-in-place order was associated with an overall decline in trauma volume, violence-related injuries persisted. Delineating and addressing underlying factors driving persistent violence-related injuries during shelter-in-place orders should be a focus of public health efforts in preparation for future pandemic responses.
Keywords: trauma, epidemiology, COVID-19, violence
INTRODUCTION
In response to the COVID-19 pandemic, large scale efforts have been undertaken to mitigate the spread of the SARS-CoV-2 virus. These efforts include social distancing, initially by school and business closures, bans on large gatherings, and transition to work from home, followed by more comprehensive shelter-in-place orders. These measures directly limit several patterns of human behavior that are associated with traumatic injury, such as road traffic, in person social interactions, and hazardous outdoor activities (1, 2). Consistent with this, a number of trauma centers and departments of public health reported significant reductions in traumatic injuries in the initial period following county-level shelter-in-place orders (3–7). Despite overall lower rates of traumatic injury, there have been concerns over a persistence of violence-related injuries during the global pandemic. Sutherland and colleagues reported paradoxical increases in gun violence in three major cities in the United States (8). Further, with social isolation measures and school closures, several investigators have described concerning trends in domestic violence (9–12), and increased rates of self-harm, pediatric injuries, and child abuse (13–16). These reports underscore that certain populations remain at risk or perhaps even increased risk for injury during the COVID-19 pandemic. Whether these trends have persisted and how they have changed since these initial studies remains unknown. Understanding these epidemiologic patterns may better inform trauma care and public health responses to the current COVID-19 pandemic and future global pandemics.
The City and County of San Francisco, California, along with five adjacent counties, were among the first in the nation to adopt a comprehensive shelter-in-place order to contain the spread of SARS-CoV-2, with a resultant relatively mild initial surge in COVID-19 cases and hospitalizations (17). Zuckerberg San Francisco General Hospital serves as San Francisco’s only trauma center, providing an ideal opportunity to perform a detailed evaluation of the association of shelter-in-place on trauma volume and injury patterns at the county level. To quantify and characterize changes in trauma epidemiology, we performed an interrupted time-series analysis of trauma volume and injury mechanisms, accounting for historical weekly and monthly temporal trends. Based on our initial clinical observations, we hypothesized that the shelter-in-place order led to a decrease in trauma volume overall. However, we further hypothesized that while the number of non-violent injuries decreased, violence-related injuries persisted during shelter-in-place.
METHODS
Study Design and Population
We performed a single-center retrospective study of adult and pediatric trauma volume at Zuckerberg San Francisco General Hospital, an California state designated and American College of Surgeons verified adult level 1 trauma center, and the only trauma center serving the City and County of San Francisco and northern San Mateo County. Trauma volume was defined by all trauma team activations in the trauma registry. In addition, we analyzed the following subgroups: pediatric (age<15 years), violence-related injury mechanisms versus non-violent mechanisms of injury, and demographic subgroups (age, sex, race/ethnicity). Violence-related injury mechanisms included all blunt and penetrating assaults, and self-harm. Non-violent injury mechanisms encompassed all other injuries, primarily due to falls, traffic-related injuries, occupational injuries, and a small volume of burns and other injuries. Demographics and mechanism subgroups were determined by review of trauma registry and ICD-10 diagnosis codes. Trauma team activation criteria at our institution are divided into a two-tiered acuity system, based upon specific mechanism of injury criteria and physiologic variables (Supplemental Figure 1, http://links.lww.com/TA/B859), and both levels were included in our analyses. Finally, we analyzed publicly available crime data from the San Francisco Police Department by month, which was available from January 2016 to June 2020 (18). This study was approved by the Committee on Human Subjects Research at the University of California, San Francisco.
Interrupted Time-Series Analyses
An interrupted time-series analysis (ITSA) was used to model the changes in trauma epidemiology associated with the county-wide shelter-in-place order instituted in the City and County of San Francisco, California on March 17th, 2020 to account for temporal (weekly and monthly) variations in trauma volume and mechanisms of injury. To control for short-term trends, data at the weekly level starting 6 months before shelter-in-place were analyzed (short-term ITSA- September 2019 through June 2020). To control for long-term trends and known seasonal fluctuations in traumatic injuries, data at the monthly level for 5 years before shelter-in-place were analyzed (long-term ITSA- January 2020 through June 2020). All ITSAs were performed using the ordinary least squares method with Newey-West standard errors (19). We included a linear time term to account for historical temporal trends, as well as a month indicator to control for the known troughs (in winter months) and peaks (in summer months) in trauma volume.
The ITSA model reports several key measures of association of the timing of the intervention (start of shelter-in-place on March 17th 2020) with the outcomes (trauma volume, demographics, mechanisms): 1) Historical (pre-shelter-in-place) trend (slope) 2) Level-shift associated with shelter-in-place (instantaneous change in the y-axis) 3) Trend (slope) after the start of shelter-in-place, and 4) Change in the trend (slope) after the start of shelter-in-place (post-shelter-in-place slope – pre-shelter-in-place slope) (Supplemental Figure 2, http://links.lww.com/TA/B859). Additionally, a multiple group ITSA was used to assess the differential effect of shelter-in-place on violence-related versus non-violent mechanisms of injury. The multiple group ITSA reports the above measures as the difference between trends and level-shifts between the two groups associated with shelter-in-place (19). A Cumby-Huizinga test was used to assess for temporal autocorrelation, and based on this, standard error adjustments were incorporated for up to a 12-month lag in the long-term ITSA models and up to a 4-week lag in the short-term ITSA models (19). All data analyses were performed in Stata (Version 15, Stata Corps).
RESULTS
Adult and Pediatric Trauma Volume
A total of 20,129 trauma team activations from January 2015 through June 2020 were included in the study, with median (interquartile ranges) of 312 (260-344) adult and 17 (14–21) pediatric trauma team activations per month. When comparing monthly trauma volume over the prior five years (January 2015 through February 2020), there was an overall linear decrease of 2.8 fewer trauma team activations per month (p<0.01), as well as consistent yearly sinusoidal patterns with troughs during winter months and peaks during summer months in the long-term ITSA model (Figure 1a and Figure 2). When controlling for the gradual long-term decline in trauma volume and the month of the year, there was a significant drop (level shift) of 26 trauma team activations per month associated with shelter-in-place (p=0.01, Figure 1a and Supplemental Table 1, http://links.lww.com/TA/B859). Subsequently, there was a non-significant increase in monthly trauma volume from March to June 2020 (p=0.08, Figure 1a). Trauma volume for April through June 2020 remained below the interquartile ranges for the years 2015-2019 (Figure 2 and Supplemental Table 1, http://links.lww.com/TA/B859). The observed changes in trauma volume were accounted for by similar changes in both high and low acuity trauma activations.
Figure 1. Comparison of trauma volume before and after shelter-in-place.
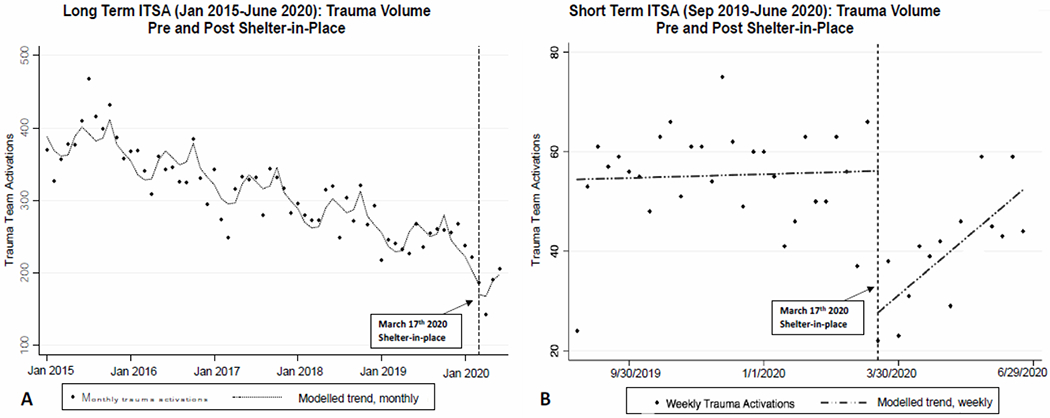
A) Long-term interrupted time-series analysis (ITSA) for trauma volume at monthly intervals, showing overall decline in trauma team activations for the past five years. Pre-shelter-in-place monthly trend from January 2015-February 2020 of 2.8 fewer activations per month (p<0.01), a level-shift of 26 fewer activations per month with the start of shelter-in-place (p=0.01), and a non-significant rise from March to June less than expected compared to prior years (p=0.08). B) Short-term ITSA for volume at weekly intervals showing flat pre-shelter-in-place weekly trend (coefficient 0.06, p=0.80), a level-shift of 28 fewer activations per week associated with the start of shelter-in-place (p<0.01), and a post-shelter-in-place linear increase of 2 activations per week (p<0.01). Lags specified for autocorrelation: 12 months in A, and 4 weeks in B. See Supplemental Tables 1 and 2 (http://links.lww.com/TA/B859) for complete ITSA model results.
Figure 2. Comparison of monthly trauma volume 2015-2019 vs 2020.
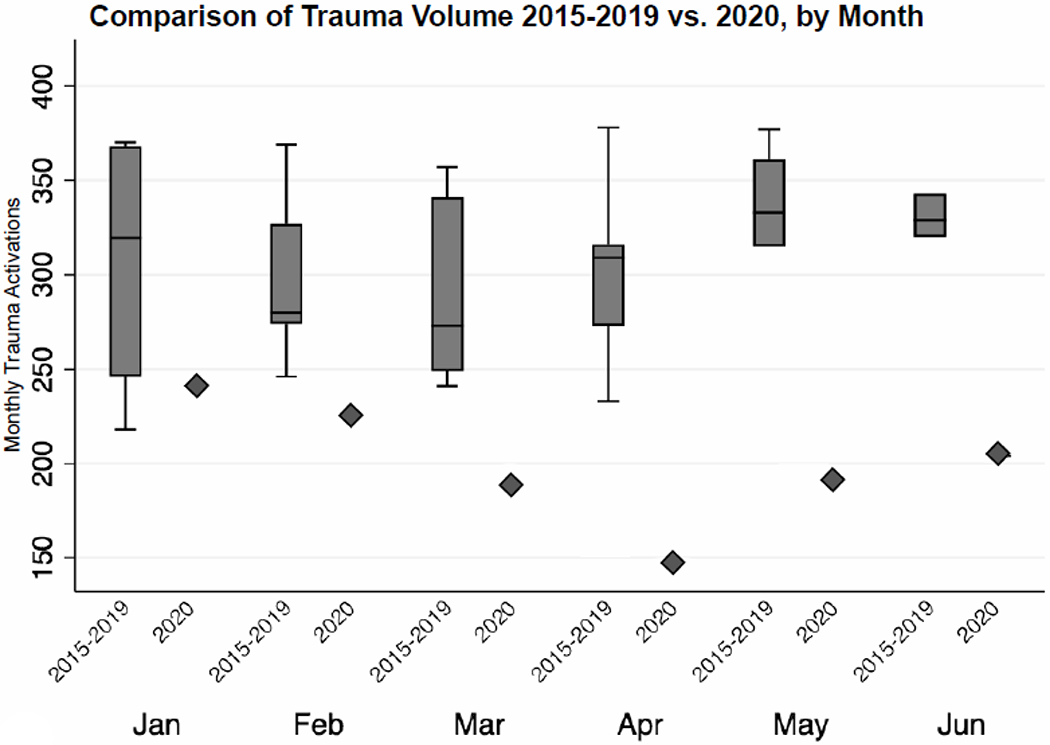
Box and whiskers plots for 2015-2019 compared to 2020 values (diamonds) for January through June.
We then examined variations in trauma volume at a more detailed level, by week. When comparing weekly trauma volume in the six months prior to shelter-in-place, there was no significant trend (paralleling the expected low but stable rates in the long-term data during fall and winter months). However, a large decline of 50% was observed in association with shelter-in-place (p<0.01), followed by a linear increase of two additional trauma team activations per week despite shelter-in-place (p<0.01, Figure 1b and Supplemental Table 2, http://links.lww.com/TA/B859).
For pediatric trauma team activations (median age 11, IQR 6-13), we observed similar patterns, but with an expected lower injury frequency given the low volume of pediatric trauma at our institution. In the long-term ITSA model, there was a gradual decline in trauma volume from 2015-2020, with troughs in winter months and peaks in early summer and fall months (Figure 3a). However, there was a clear drop in pediatric trauma volume associated with shelter-in-place (p<0.01), followed by a rate of monthly increase in pediatric trauma volume that was not different from expected historical increases in spring and summer months (p=0.43, Figures 3a and Supplemental Table 3, http://links.lww.com/TA/B859), though absolute totals were still below the interquartile ranges from 2015-2019 for each corresponding month (Figure 4). In the short-term ITSA model, there was a non-significant decline in the six months pre-shelter-in-place and a small but significant level-shift associated with shelter-in-place (p=0.02, Figure 3b and Supplemental Table 4, http://links.lww.com/TA/B859). This was followed by a linear increase after shelter-in-place, paralleling the long-term ITSA model (p=0.05, Figure 3b and Supplemental Table 4, http://links.lww.com/TA/B859).
Figure 3. Comparison of pediatric trauma volume before and after shelter-in-place.
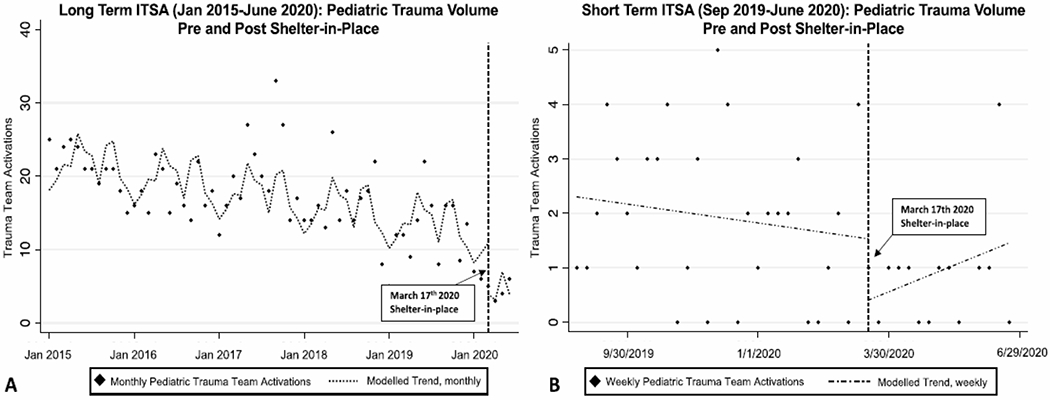
A) Long-term interrupted time-series analysis (ITSA) for pediatric trauma volume at monthly intervals, showing a slight decline over past five years. Pre-shelter-in-place trend from January 2015-February 2020 was 0.14 fewer pediatric trauma team activations per month, p<0.01), with a significant level shift associated with shelter-in-place of 7.0 fewer pediatric trauma team activations (p<0.01), and increases from March to June not different from corresponding months in prior years (p=0.72) B) Short-term ITSA for pediatric trauma volume at weekly intervals demonstrated a decreasing pre-shelter-in-place 6 month trend (coefficient −0.10, p<0.01), a level shift by one less pediatric trauma team activation per week associated with the first week of shelter-in-place (p<0.14), post-shelter-in-place trend of 0.15 more trauma team activations per week (p<0.09), and a slope change from pre to post-shelter-in-place of 0.25 (p=0.01). Lags specified for autocorrelation: 12 months in long-term ITSA and 4 weeks in short-term ITSA. See Supplemental Tables 3 and 4 (http://links.lww.com/TA/B859) for complete ITSA model results.
Figure 4. Comparison of monthly pediatric trauma volume 2015-2019 vs 2020.
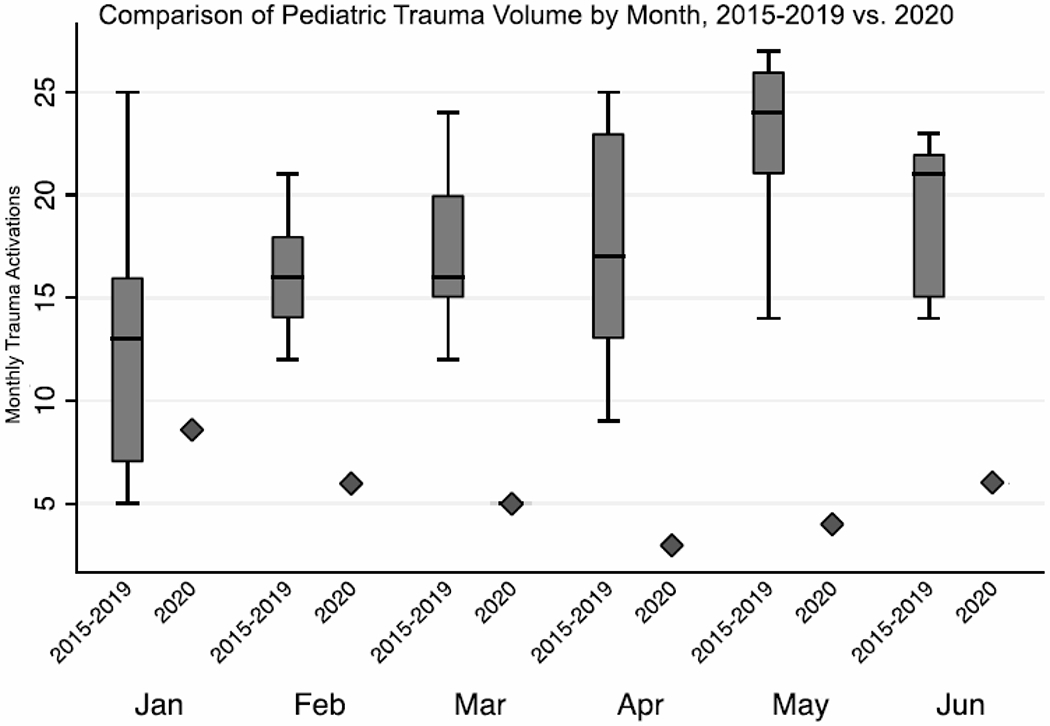
Box and whiskers plots for 2015-2019 compared to 2020 values (diamonds) for January through June.
Violence-Related vs Non-Violent Mechanisms of Injury
We then examined the specific injury mechanisms that contributed to the observed changes in overall trauma volume. Given our clinical observations and prior reports of persistent violence-related injury during shelter-in-place in other cities, we compared trauma volume due to violence-related injury mechanisms to non-violent injury mechanisms, controlling for the historical trends six months prior to shelter-in-place. Using a multiple-group ITSA to assess the differential effect of shelter-in-place on violence-related versus non-violent injury mechanisms, we found that non-violent injury mechanisms dropped by 27 trauma team activations per week in association with shelter-in-place, while violence-related mechanisms showed no change with shelter-in-place (p<0.01 for difference, Figure 5 and Supplemental Table 5a, http://links.lww.com/TA/B859). Violence-related injury mechanisms accounted for 17% of all trauma volume during the six months prior to shelter-in-place, but in the first week of shelter-in-place, this number increased to 46%. The initial large drop in non-violent injury mechanisms was followed by a subsequent steady increase, while violence-related injury mechanisms persisted and slightly increased (p<0.01, Figure 5 and Supplemental Table 5a, http://links.lww.com/TA/B859). When examining violent mechanism subtypes, there was a trend towards increased gunshot wounds during shelter-in-place (p=0.10), while rates of blunt assaults, stab wounds, and self-harm were unchanged (Supplemental Table 5b, http://links.lww.com/TA/B859). For non-violent mechanism subtypes, the largest decreases were seen in pedestrian vs auto injuries (−71%) and motorcycle collisions (−51%), while smaller relative decreases occurred in falls (−37%) and motor vehicle collisions (−27%, all p<0.05), and bicycle vs auto collisions were not significantly changed (Supplemental Table 5b, http://links.lww.com/TA/B859).
Figure 5. Comparison of weekly violence-related vs non-violent injury mechanisms before and after shelter-in-place.
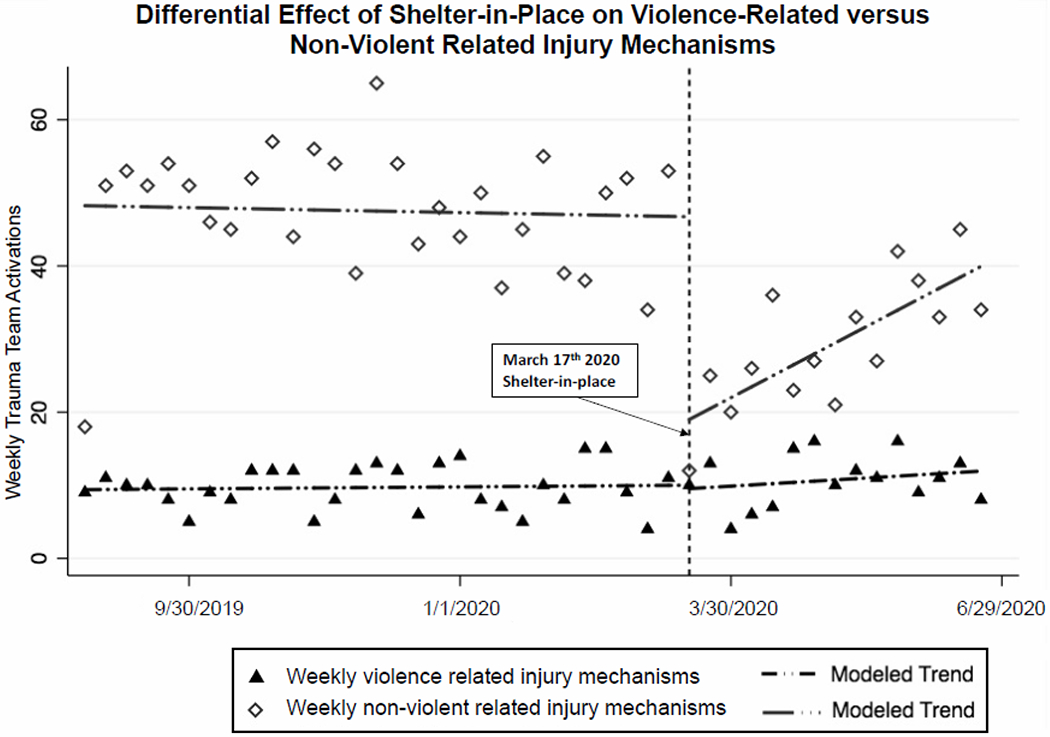
ITSA model for violence-related vs. non-violent injury mechanisms at weekly intervals, lags specified for autocorrelation: 4 weeks. While pre-shelter-in-place trends for both violence-related and non-violent injury mechanisms was stable, a large difference in level shift is notable in association with shelter-in-place for non-violent injury mechanisms, but there was no level change in violence-related injury mechanisms (p<0.01). After shelter-in-place, a gradual and significant increase in non-violent injury mechanisms was noted (p<0.01), but no significant change (slight upward trend) in violence-related injury mechanisms. See Supplemental table 5b (http://links.lww.com/TA/B859) for complete ITSA model results.
San Francisco Crime Reports
We next examined publicly reported data on violent crimes and homicides from the San Francisco Police Department (18). We found that when accounting for 2016-2019 historical data, there was a decrease overall in reported violent crimes (assaults, rape, armed robbery, homicides, and human trafficking; p<0.01, Supplemental Figure 3, http://links.lww.com/TA/B859 and Supplemental Table 6, http://links.lww.com/TA/B859). Notably however, when examining homicides specifically, there was paradoxical small but significant level increase in association with shelter-in-place (p=0.01), followed by a post-shelter-in-place trend from March to June similar to corresponding months historically (p=0.15, Figure 6 and Supplemental Table 7, http://links.lww.com/TA/B859).
Figure 6. Comparison of number of monthly homicides reported in San Francisco before and after shelter-in-place.
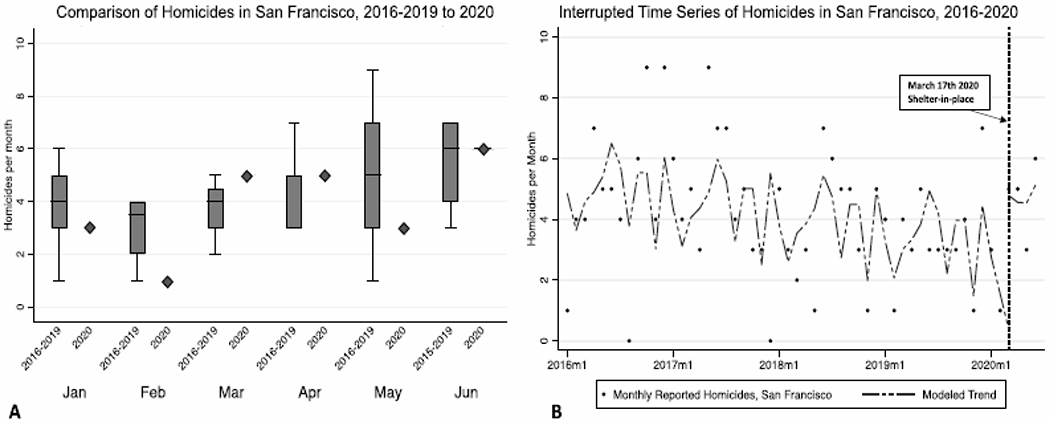
A) Box and whiskers plots of historical homicides reported by month 2016-2019 compared to 2020 values (diamonds). B) ITSA model for homicides reported by month adjusting for historical variation, showing slight downtrend with seasonal monthly variation from 2016-2019, but with a significant level shift increase associated with shelter-in-place of 2.3 more homicides per month compared to historical levels (p=0.01) and non-significant decrease after shelter-in-place (p=0.15). Lags specified for autocorrelation: 12 months. See Supplemental Table 7 (http://links.lww.com/TA/B859) for complete ITSA model results.
Demographics
We also analyzed patient demographics before and after shelter-in-place. Again, using an ITSA approach, we found that there was a significant level shift up in the percentage of male compared to female trauma patients by 8% (p<0.01), and a statistically significant downtrend in the mean age of trauma patients after shelter-in-place, estimating that trauma patients at the end of our study period were on average 7 years younger than those in the week prior to shelter-in-place (p<0.01, Supplemental Table 8a and 8b, http://links.lww.com/TA/B859).
When evaluating changes in patient race/ethnicity demographics, we found a level shift down in the percentage of Asian trauma patients by 8% (p<0.01) in association with the start of shelter-in-place, and a non-significant post shelter-in-place trend towards increased percentages of Black and Native Hawaiian/Pacific Islander trauma patients (both p=0.09, Supplemental Table 8c, http://links.lww.com/TA/B859). It should also be noted that there was a statistically significant level shift up (p=0.03) and subsequent downtrend (p<0.01) in the percentage of White trauma patients, however this relationship was driven by two significant outliers in the data (Supplemental Table 8c, http://links.lww.com/TA/B859). Finally, there was a statistically significant increase in the percentage of patients listed as unknown race/ethnicity after shelter-in-place (p<0.01), limiting our ability to draw clear conclusions regarding these demographic trends (Supplemental Table 8c, http://links.lww.com/TA/B859).
DISCUSSION
In this study, we have quantified important epidemiologic changes in injury-related visits to the only trauma center serving the City and County of San Francisco and northern San Mateo County following institution of one of the earliest COVID-19 shelter-in-place orders in the United States. The shelter-in-place order was instituted in the City and County of San Francisco and five adjacent counties (including San Mateo County) on March 17th 2020, and required that all residents stay at home except for essential activities, and that all but the most essential business and services close. This order did begin to relax in a limited fashion on May 17th with opening of some outdoor businesses, and was followed by additional opening of indoor retail stores, outdoor dining, and parks in June, though indoor dining, bars, schools and summer camps, large gatherings, and non-essential offices remained closed (20).
While overall trauma volume significantly decreased, we demonstrated that this was exclusively accounted for by decreases in non-violent injury mechanisms. It is not surprising that injuries sustained through non-violent mechanisms such as occupational injuries, falls, and traffic related injuries decreased in the setting of shelter-in-place, given the large-scale transition to work from home, decreased outdoor activities, and fewer reported motor vehicle collisions (6, 21, 22). However, this initial decrease was temporary, as we identified a steady and linear increase in trauma activations following the initial decline, although volume did remain below historical April-June averages.
Our identification of persistent violence-related injury mechanisms highlights differential consequences of the public health shelter-in-place orders. Despite a decrease in reported violent crimes after shelter-in-place, we found paradoxically that violence-related injury mechanisms persisted, accounting for 46% of the mechanisms of injury during shelter-in-place (up from 17%). Paralleling this, there was a small but significant increase in homicides compared to historical trends in San Francisco. Other cities, including Philadelphia, PA, Baltimore, MD, Los Angeles, CA, New York City, NY and Chicago, IL, have all reported persistent or increasing levels of gun violence during the beginning of the COVID-19 pandemic despite shelter-in-place orders designed to limit human to human interaction (8, 23, 24). Our findings build upon these initial studies by showing these trends have persisted over a longer study period and when controlling for longer term temporal variations in injury patterns. The congruency of violence-related injury trends across these cities is notable despite differences their respective sizes, geographic location, as well differences in shelter-in-place orders and in the intensity of their respective COVID-19 outbreaks. This underscores the need to better understand the common underlying drivers and behaviors in the context of the pandemic to inform and appropriately adapt public health pandemic protections for those at risk of violence-related injuries. Some of the drivers of persistent violence-related injury despite shelter-in-place may include the increased financial insecurity, psychosocial stressors, and decreased access to health and social services occurring on large scales during the COVID-19 pandemic (15).
Our data do not include whether an injury was related to domestic violence or abuse, but others have reported increases in domestic violence and child abuse since the start of the pandemic (11, 15, 25). We identified a trend towards increased gunshot wounds, and no change in the rate of blunt assaults and stab wounds during the pandemic. It will be important to further define the causes of these persistent violence-related injuries occurring during shelter-in-place, as there may be several underlying patterns, such as an increase in domestic and interpersonal community violence, but a decrease in assaults related to armed robbery as suggested by the San Francisco crime report data. It is also known that social isolation and quarantine predisposes to exacerbation of mental health crises and suicidality (13, 26), but we did not observe increases in self-harm related injuries, which remained stable and low overall (1% of all trauma team activations and 5% of violence-related injury mechanisms). This may be due to the fact that our baseline level of self-harm injuries was low enough that we may not have sufficient power to detect a small change, or because increases in self harm could present by non-traumatic means (such as substance overdoses), which would not be captured by our results.
Although we did not find any large shifts in the demographics of trauma patients by race/ethnicity, we did observe an increase in the proportion of male trauma patients, and a small decrease in the mean age of trauma patients following shelter-in-place. This is not unexpected given that males are more likely to engage in risky behaviors (27, 28) and therefore may be less likely to adhere to shelter-in-place. The same may be true for younger compared to older age groups (29).
Our analyses have several important limitations to consider. First, due to availability of certain patient-level variables, we were only able to perform short term ITSA starting six months prior to shelter-in-place for analysis of violence-related vs non-violent related injury mechanisms, age, sex, and race/ethnicity. Second, while our findings are representative of the experience of our trauma center at a local level, the changes in trauma epidemiology are likely moderated by a host of factors that vary regionally during the global pandemic, such as urban versus rural locations and by both the intensity of the COVID-19 outbreak and stringency of and adherence to shelter-in-place. We chose to include all trauma team activations in the trauma registry as our measure of trauma volume, however, this does not encompass the lowest acuity injuries (non-activated traumas) presenting to our institution. We found significant trends in pediatric trauma volume, but it should be noted that these represent a small fraction of injuries overall both during shelter-in-place and historically at our trauma center. Lastly, while our analysis leverages the timing of shelter-in-place as the inflection point, this is likely just one factor among several that may influence the observed trends in injuries during the COVID-19 pandemic. We chose shelter-in-place as our marker given it was the most stringent measure and was instituted very early in San Francisco during the initial wave of the outbreak. However, some measures such as bans on large gatherings, sporting events, and transition to work from home by several large employers started in early March in San Francisco. The transition to work from home may be a particularly important factor for traffic related injuries given that a large proportion of San Francisco’s daytime population includes a commuting workforce from adjacent counties. The long term ITSA models account for these preliminary measures which occurred in early March 2020 given the coarser monthly time intervals assessed, while the weekly models more specifically evaluate the timing of shelter-in-place. Despite this intervention, the shelter-in-place order did not appear to protect the City and County of San Francisco from violence-related injuries.
In conclusion, we found the decrease in traumatic injuries associated with an early and stringent shelter-in-place order was primarily due to an initial profound drop in non-violent injury mechanisms directly followed by a steady, but lower-than-expected increase from spring to summer months. In contrast, violence-related injuries have persisted throughout the COVID-19 pandemic at or above historical levels, suggesting that large scale social distancing and shelter-in-place orders do not protect those at risk for violence-related injuries (15, 30). This highlights the need to increase resources for violence prevention programs during the pandemic and to help them adjust to social distancing mandates. For example, at our institution, case managers working for our violence prevention program have had to adapt to the numerous logistical challenges of enrolling and working with patients remotely due to ongoing social distancing restrictions.
It will also be important to further characterize changes in trauma epidemiology at regional and national levels during the pandemic to better inform allocation of scarce resources including blood, ventilators, and personal protective equipment during the ever-changing dynamics of the pandemic. Even in the setting of resource limitations, trauma centers should continue to maintain a high level of preparedness to ensure the ongoing ability to care for injured patients (7, 31), as traumatic injuries, and particularly those due to violence-related injury mechanisms, have persisted despite ongoing social distancing restrictions.
Supplementary Material
Acknowledgements:
Zuckerberg San Francisco General Department of Surgery Trauma Nurse Practitioners and staff
Funding information: Dr. L Kornblith is supported by NIH 1K23GM130892-01 and UL1 TR001872; Drs. A Kornblith and Z Matthay are supported by UL1 TR001872; Dr. E Matthay is supported by K99 AA028256
Footnotes
Level of Evidence: prognostic study, level III
Disclosure outside the scope of this work: none
Disclosure information: The authors report no conflicts of interest
References
- 1.Kopf D Traffic collisions are plummeting in several US cities. Quartz. March 24, 2020. Available from: https://qz.com/1822492/traffic-accidents-are-plummeting-because-of-the-pandemic/. Accessed April 16 2020. [Google Scholar]
- 2.Nieuwenhuijsen M COVID-19 and the City: How is the Pandemic Affecting Urban Health? ISGlobal. March 25, 2020. Available from: https://www.isglobal.org/en/healthisglobal/-/custom-blog-portlet/covid-19-en-las-ciudades-como-esta-afectando-la-pandemia-a-la-salud-urbana-/4735173/0. Accessed April 16, 2020. [Google Scholar]
- 3.Forrester JD, Liou R, Knowlton LM, Jou RM, Spain DA. Impact of shelter-in-place order for COVID-19 on trauma activations: Santa Clara County, California, March 2020. Trauma Surg Acute Care Open. 2020. May 7;5(1):e000505. [DOI] [PMC free article] [PubMed] [Google Scholar]
- 4.Aljuboori Z, Sieg E. The early effects of social distancing resultant from COVID-19 on admissions to a Level I trauma center. Injury. 2020. October;51(10):2332. [DOI] [PMC free article] [PubMed] [Google Scholar]
- 5.University of California, Davis. Special Report (Update): Impact of COVID-19 Mitigation on Numbers and Costs of California Traffic Crashes. https://roadecology.ucdavis.edu/. Published April 2020. Accessed May 15, 2020.
- 6.Zhu W, Yang J, Xu L, Fang S. A plunge in the number of traumatic traffic injuries in an emergency center in Anhui province, China. Am J Emerg Med. 2020. March 20:S0735-6757(20)30169-8. [DOI] [PMC free article] [PubMed] [Google Scholar]
- 7.Halvachizadeh S, Teuben M, Berk T, Neuhaus V, Pape HC, Pfeifer R. The impact of SARS-CoV-2 (COVID-19) pandemic on trauma bay management and guideline adherence in a European level-one-trauma centre. Int Orthop. 2020. September;44(9):1621–1627. [DOI] [PMC free article] [PubMed] [Google Scholar]
- 8.Sutherland M, McKenney M, Elkbuli A. Gun violence during COVID-19 pandemic: Paradoxical trends in New York City, Chicago, Los Angeles and Baltimore. Am J Emerg Med. 2020. May 7:S0735-6757(20)30344-2. [DOI] [PMC free article] [PubMed] [Google Scholar]
- 9.Boserup B, McKenney M, Elkbuli A. Alarming trends in US domestic violence during the COVID-19 pandemic. Am J Emerg Med. 2020. April 28:S0735-6757(20)30307-7. [DOI] [PMC free article] [PubMed] [Google Scholar]
- 10.Neil J Domestic violence and COVID-19: Our hidden epidemic. Aust J Gen Pract. 2020. June; 11;49. [DOI] [PubMed] [Google Scholar]
- 11.Sacco MA, Caputo F, Ricci P, Sicilia F, De Aloe L, Bonetta CF, Cordasco F, Scalise C, Cacciatore G, Zibetti A, et al. The impact of the Covid-19 pandemic on domestic violence: The dark side of home isolation during quarantine. Med Leg J. 2020. July;88(2):71–3. [DOI] [PubMed] [Google Scholar]
- 12.Valera EM. When pandemics clash: Gendered violence-related traumatic brain injuries in women since COVID-19. EClinicalMedicine. 2020. June;24:100423. [DOI] [PMC free article] [PubMed] [Google Scholar]
- 13.Calati R, Ferrari C, Brittner M, Oasi O, Olie E, Carvalho AF, Courtet P. Suicidal thoughts and behaviors and social isolation: A narrative review of the literature. J Affect Disord. 2019. June;245:653–67. [DOI] [PubMed] [Google Scholar]
- 14.Rosenthal CM, Thompson LA. Child Abuse Awareness Month During the Coronavirus Disease 2019 Pandemic. JAMA Pediatr. 2020. August;174(8):812. [DOI] [PubMed] [Google Scholar]
- 15.Peterman APA, O’Donnell M. Pandemics and violence against women and children. Center Global Dev Work Paper. DC: Center for Global Development 2020. Available from: https://www.cgdev.org/publication/pandemics-and-violence-against-women-and-children. Published April 1, 2020. Accessed May 30, 2020.
- 16.Cluver L, Lachman JM, Sherr L, Wessels I, Krug E, Rakotomalala S, Blight S, Hillis S, Bachman G, Green O, et al. Parenting in a time of COVID-19. Lancet. 2020. April;395(10231):e64. [DOI] [PMC free article] [PubMed] [Google Scholar]
- 17.Bayles BR, George MF, Hannah H, Culross P, Ereman RR, Ballard DW, et al. Impact of the first COVID-19 shelter-in-place order in the United States on emergency department utilization, Marin County, California. MedRxIV Preprint Server for Health Sciences. Preprint 2020 Jul; 10.1101/2020.07.01.20144691 [DOI] [Google Scholar]
- 18.Crime Reports: CompStat Policing in San Francisco 2015-2020. Available from: https://www.sanfranciscopolice.org/stay-safe/crime-data/crime-reports. San Francisco Police Department. San Francisco, CA. Accessed July 20th, 2020. [Google Scholar]
- 19.Linden A Conducting interrupted time-series analysis for single and multiple group comparisons. The Stata Journal. 2015;15(2):480–500. [Google Scholar]
- 20.San Francisco Department of Public Health. Reopening San Francisco 2020. Available from: https://sf.gov/step-by-step/reopening-san-francisco. Updated October 20, 2020. Accessed October 23, 2020.
- 21.Giuntoli M, Bonicoli E, Bugelli G, Valesini M, Manca M, Scaglione M. Lessons learnt from COVID 19: An Italian multicentric epidemiological study of orthopaedic and trauma services. J Clin Orthop Trauma. 2020;11(4):721–7. [DOI] [PMC free article] [PubMed] [Google Scholar]
- 22.Pinggera D, Klein B, Thome C, Grassner L. The influence of the COVID-19 pandemic on traumatic brain injuries in Tyrol: experiences from a state under lockdown. Eur J Trauma Emerg Surg. Epub July 22 2020. [DOI] [PMC free article] [PubMed] [Google Scholar]
- 23.Hatchimonji JS, Swendiman RA, Seamon MJ, Nance ML. Trauma Does not Quarantine: Violence During the COVID-19 Pandemic. Ann Surg. 2020;272(2):e53–e4. [DOI] [PMC free article] [PubMed] [Google Scholar]
- 24.Qasim Z, Sjoholm LO, Volgraf J, Sailes S, Nance ML, Perks DH, Grewal H, Meyer LK, Walker J, Koenig GJ, et al. Trauma center activity and surge response during the early phase of the COVID-19 pandemic-the Philadelphia story. J Trauma Acute Care Surg. 2020;89(4):821–8. [DOI] [PMC free article] [PubMed] [Google Scholar]
- 25.Sidpra J, Abomeli D, Hameed B, Baker J, Mankad K. Rise in the incidence of abusive head trauma during the COVID-19 pandemic. Arch Dis Child. Epub Jul 2 2020. [DOI] [PubMed] [Google Scholar]
- 26.Lau JT, Yang X, Pang E, Tsui HY, Wong E, Wing YK. SARS-related perceptions in Hong Kong. Emerg Infect Dis. 2005;11(3):417–24. [DOI] [PMC free article] [PubMed] [Google Scholar]
- 27.Gore FM, Bloem PJ, Patton GC, Ferguson J, Joseph V, Coffey C, Sawyer SM, Mathers CD. Global burden of disease in young people aged 10-24 years: a systematic analysis. Lancet. 2011;377(9783):2093–102. [DOI] [PubMed] [Google Scholar]
- 28.Brockamp T, Koenen P, Mutschler M, Kohler M, Bouillon B, Schmucker U, Caspers M, Injury Prevention Of The German Trauma Society WG. Evaluating the impact of an injury prevention measure regarding different sociodemographic factors. J Inj Violence Res. 2018;10(1):25–33. [DOI] [PMC free article] [PubMed] [Google Scholar]
- 29.Goldstein ELM Temporal rise in the proportion of both younger adults and older adolescents among COVID-19 cases in Germany: evidence of lesser adherence to social distancing practices? MedRxIV Preprint Server for Health Sciences. Preprint Apr 11 2020. doi: 10.1101/2020.04.08.20058719 [DOI] [Google Scholar]
- 30.Talev M Axios-Ipsos Coronavirus Index: Rich sheltered, poor shafted amid virus. Axios. March 27, 2020. Available at: https://www.axios.com/axios-ipsos-coronavirus-index-rich-sheltered-poor-shafted-9e592100-b8e6-4dcd-aee0-a6516892874b.html. Accessed April 15, 2020. [Google Scholar]
- 31.Coleman JR, Burlew CC, Platnick KB, Campion E, Pieracci F, Lawless R, Werner N, Coleman J, Hoehn M, Moore EE, et al. Maintaining Trauma Care Access During the COVID-19 Pandemic: An Urban, Level-1 Trauma Center’s Experience. Ann Surg. 2020;272(2):e58–e60. [DOI] [PMC free article] [PubMed] [Google Scholar]
Associated Data
This section collects any data citations, data availability statements, or supplementary materials included in this article.


