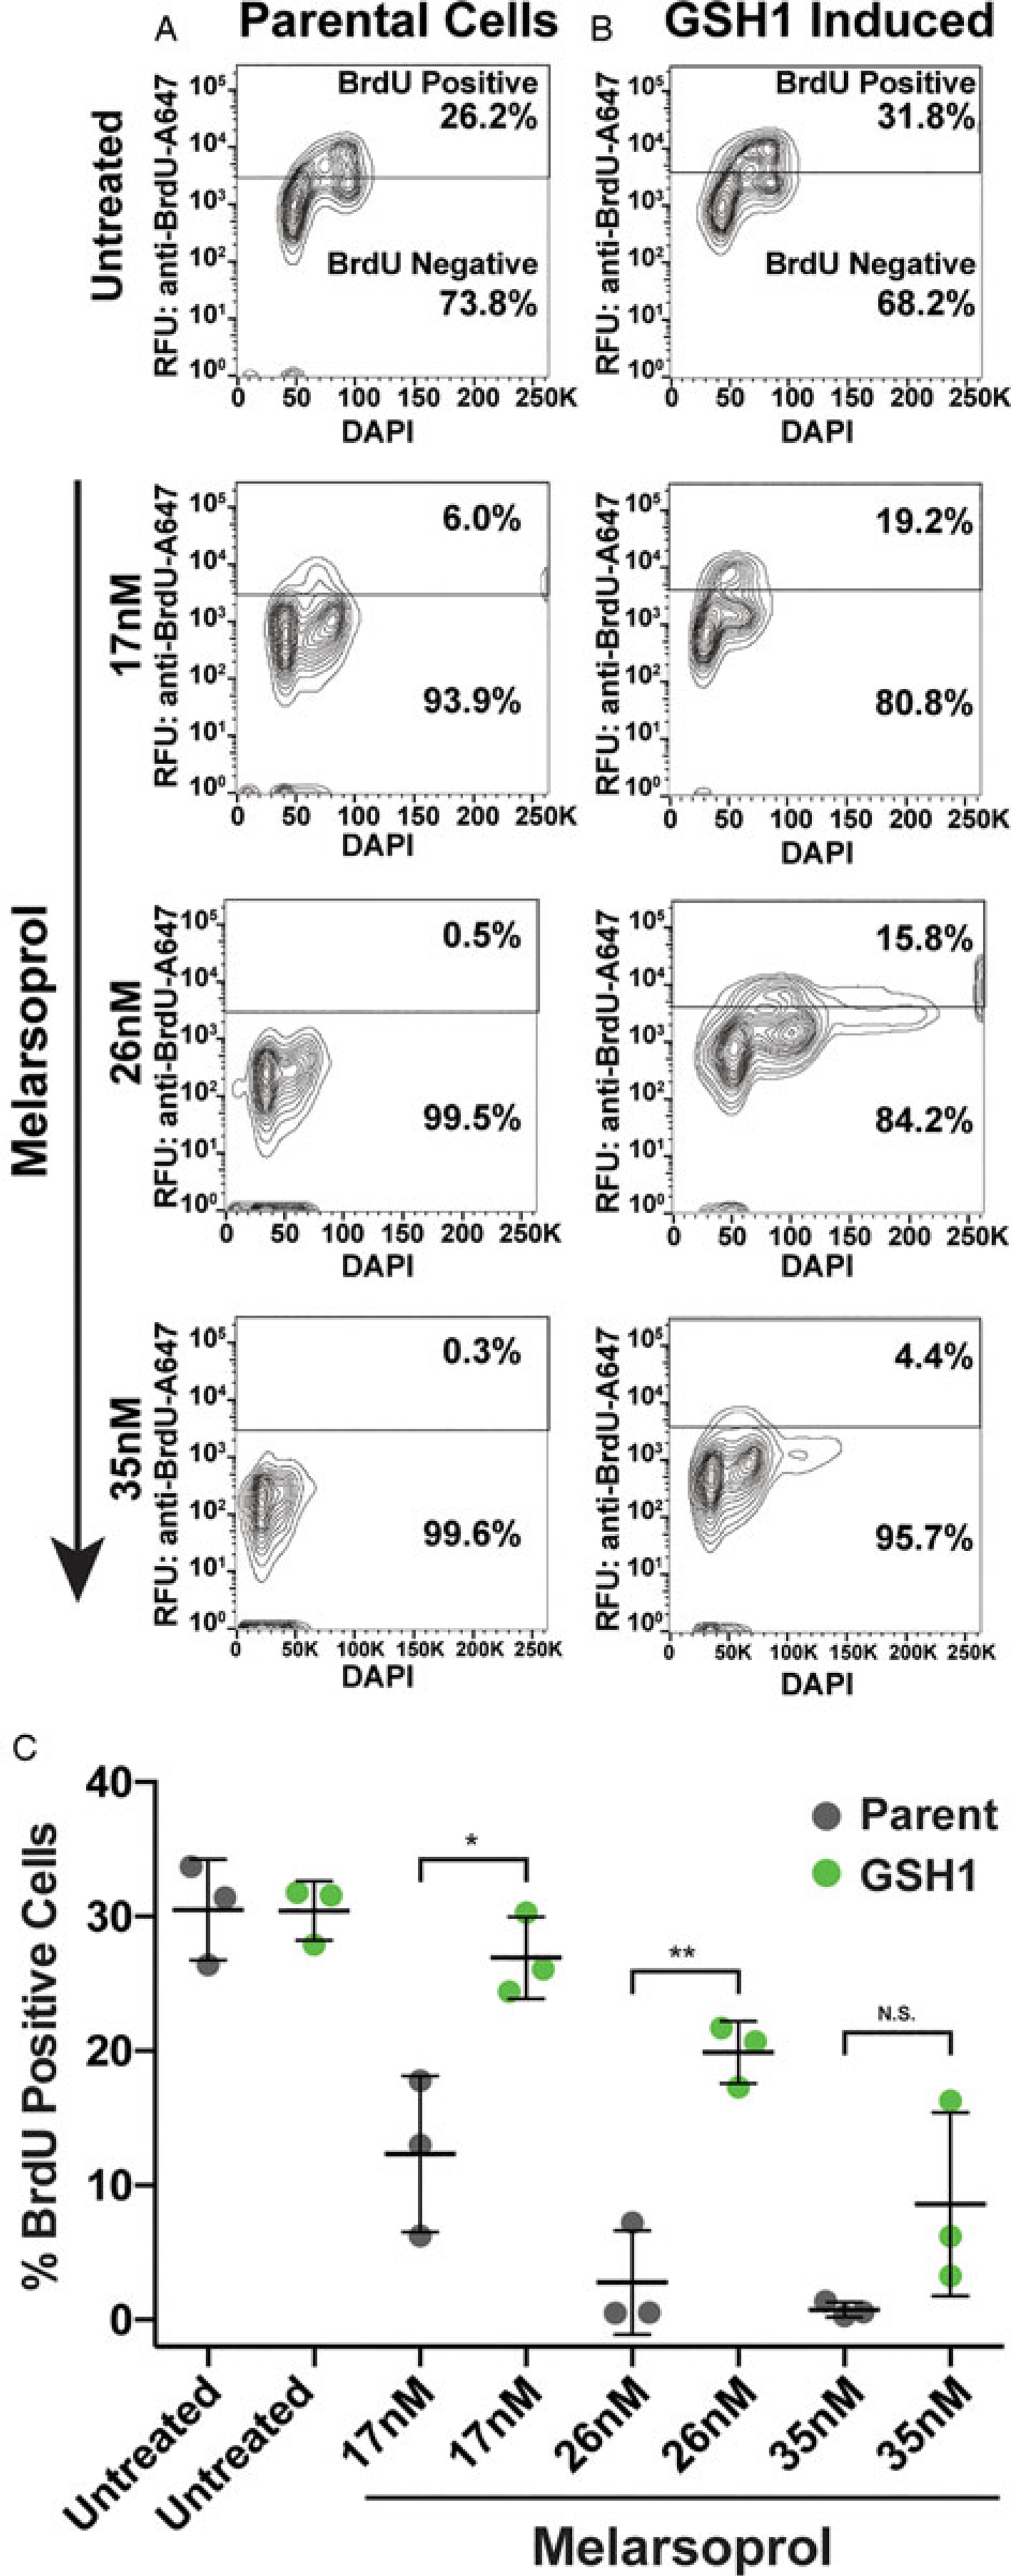
Fig. 3.

DNA synthesis during melarsoprol treatment and GSH1 overexpression. (A) DNA synthesis analysed by BrdU incorporation assay for parental cells treated with melarsoprol at the indicated drug concentrations. (B) Cell line overexpression GSH1 analysed for BrdU-positive population during melarsoprol treatment. (C) Biological triplicate data from parental cells (grey) and GSH1 overexpressing cells (green) for the per cent of BrdU-positive cells from each melarsoprol treatment condition. Statistical significance is shown in brackets over comparative data: *P <0.02 and **P <0.003.
