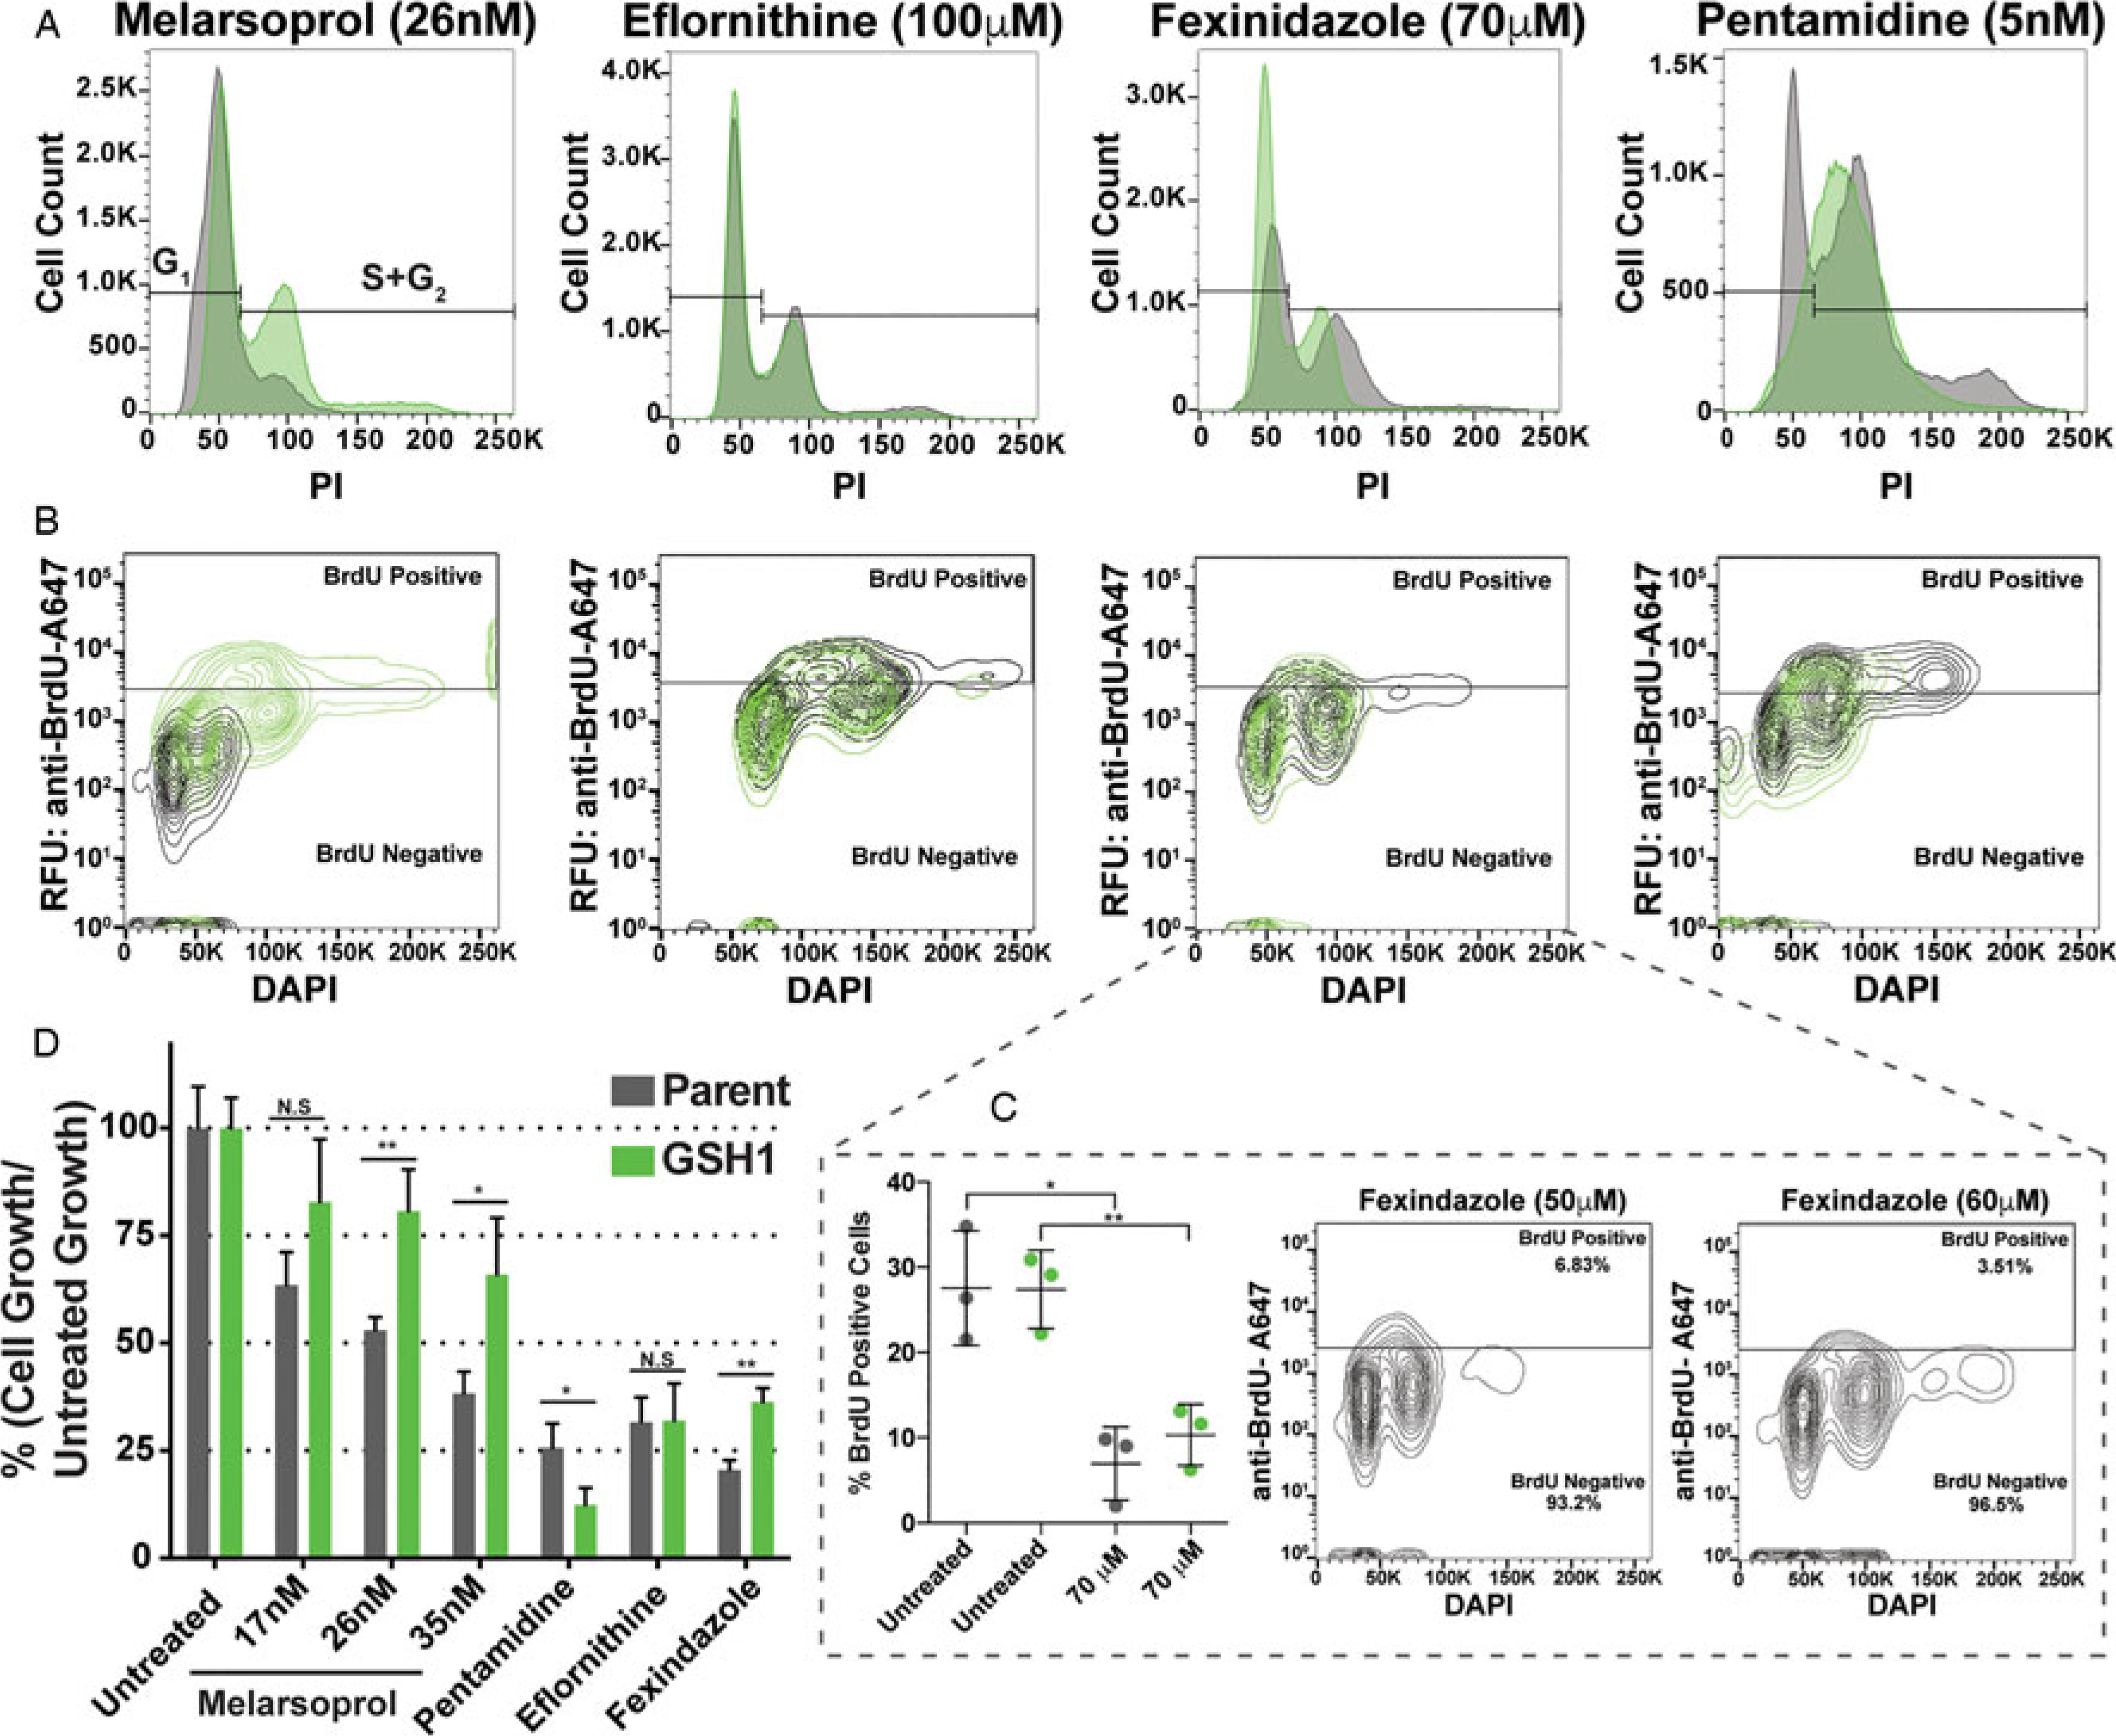
Fig. 4.

GSH1 overexpression effects during antitrypanosomal drug treatments. Comparison of parental cell line (grey) and GSH1 overexpressing cell line (green) during antitrypanosomal drug treatments for 24 h in vitro at the concentrations indicated for their effects on: (A) cell cycle, (B) DNA synthesis by BrdU incorporation assay, and (D) growth inhibition, statistical significance is shown as Not Significant (N.S or *P < 0.03 and **P < 0.002). (C) Evaluation of fexinidazole effects on DNA synthesis over biological triplicates (left graph) and at additional drug concentrations.
