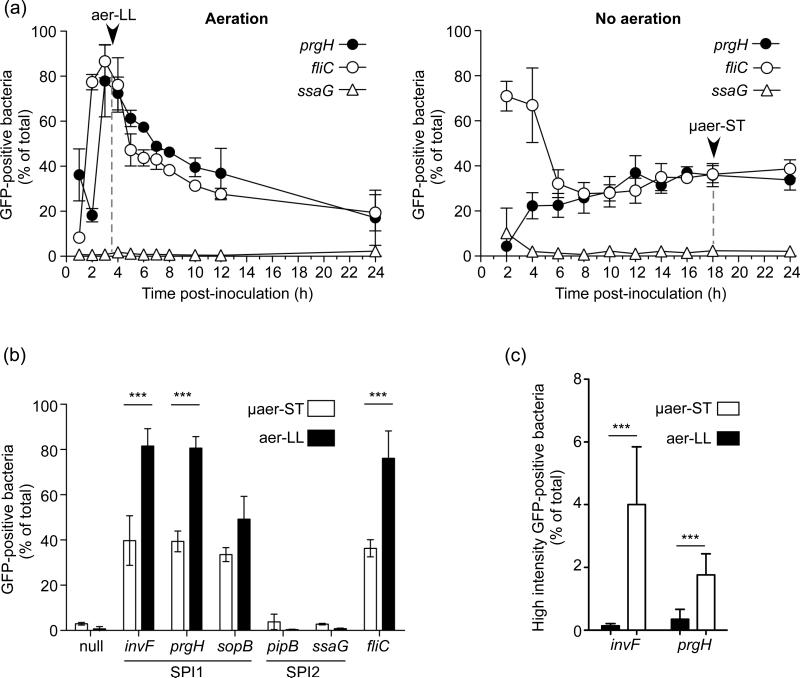
Figure 4.
Single-cell analysis of promoter activity for representative SPI1 and flagellin genes. S. Typhimurium harboring gfp[LVA] transcriptional fusions to selected promoters were analysed by flow cytometry. (a) Activity of promoters for cultures grown with (left panel) or without (right panel) aeration. Arrowheads indicate the time points at which aer-LL and μaer-ST bacteria are harvested. (b) Promoter activity in aer-LL and μaer-ST bacteria. Comparison of SPI1 regulon genes (prgH, invF and sopB), SPI2 regulon genes (pipB and ssaG), and the flagellin gene fliC. Promoterless gfp[LVA] (null) was included as a negative control. (c) Comparison of the frequencies of high intensity GFP (>104 relative fluorescent units) expressing bacteria in aer-LL and μaer-ST bacteria. Shown are means ± SD from at least three independent experiments. ***= P<0.001 Student's t-test.

