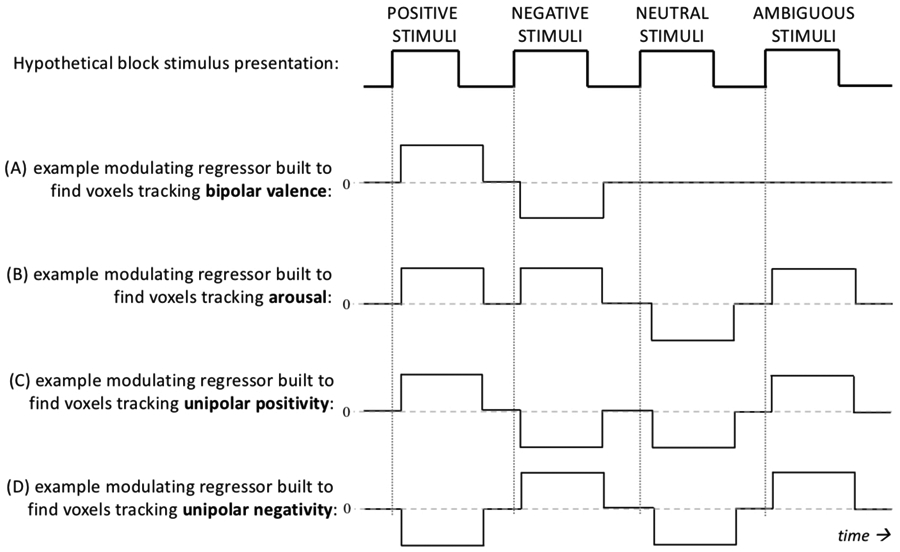
Figure 2.

A cartoon example of how different regressors, and hence different assumptions about voxel responses, are employed depending on which theoretical approach is chosen to analyses the same data. The hemodynamic response is not considered here, and choice of hemodynamic response parameters is beyond the scope of this paper. Also note that this figure assumes that the conditions positive, negative, and ambiguous all have the same arousal value, but the height of these regressors would normally vary according to continuous values on the respective measurement scales. Nonetheless, this figure illustrates how each affect theory looks for substantially different voxel response shapes. Consequently, choosing one theory or the other is the current status quo in the field of affective science, despite the fact that there is no a priori evidence that voxel responses fit any of these regressors better than the others.
