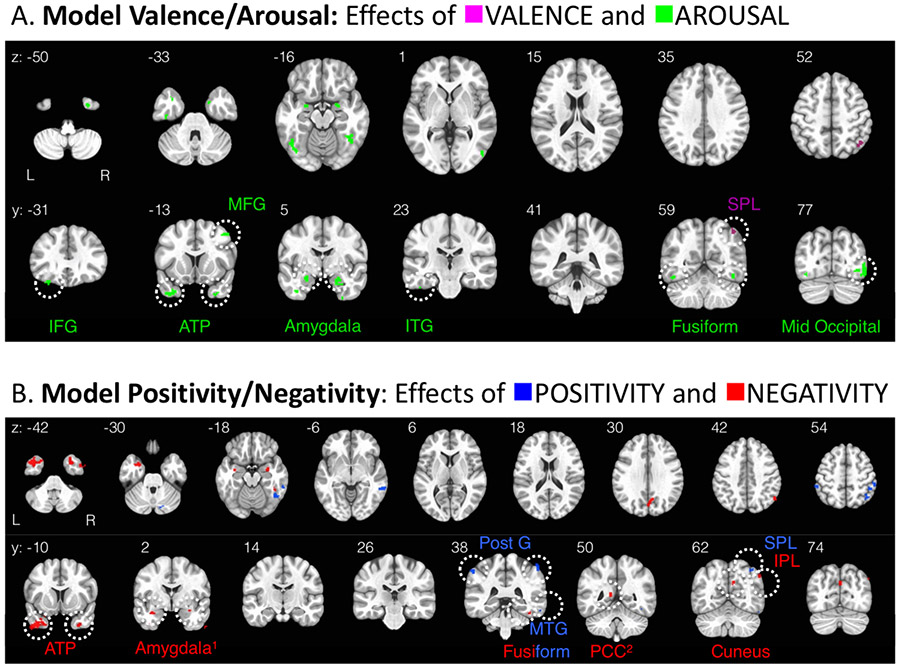
Figure 4.
Maps of functional brain regions that show statistical effects linearly related to each affective dimension: (A) Model Valence Arousal: voxels tracking linear valence are magenta and voxels tracking arousal are green; (B) Model Positivity Negativity: voxels tracking positivity are blue and voxels tracking negativity are red. Note that all (expect one2) of these functional regions have positive beta weights, and colors reflect the affective dimension the region is functionally related to, not the degree or direction of relationship. Regions yielded by Model Valence Arousal and regions yielded by Model Positivity Negativity are almost entirely non-overlapping (this is why the depicted slices are not the same for each model, see all instances of overlap in Figs 5-7). These clusters (all > 20 contiguous, 2.5 x 2.5 x 2.5 mm voxels1) survived a reasonably conservative correction that set the false discovery rate to 0.05.
Abbreviations: ATP (anterior temporal pole), IFG (inferior frontal gyrus), IPL (inferior parietal lobule), ITG (inferior temporal gyrus), MFG (middle frontal gyrus), MTG (middle temporal gyrus), PCC (posterior cingulate cortex), Post G (postcentral gyrus), SPL (superior parietal lobule).
1: Cluster size note: The cluster size threshold of 20 voxels was chosen prior to viewing the results. However, the negativity clusters for amygdala were included in this map even though they are slightly smaller in size (left: 16 contiguous voxels and right: 19 contiguous voxels) than the threshold set for the entire brain (all other regions >20 contiguous voxels), due to the general relevance of the amygdala as a region of interest in the field of affective neuroscience, we thought was important to note these clusters. The arousal-sensitive clusters within amygdala shown in (A), were >20 voxels, consistent with the whole brain threshold chosen prior to viewing the results.
2: Statistical note: The PCC region is negatively associated with negativity (i.e., has a negative mean beta weight, all other regions depicted have positive mean beta weights).

