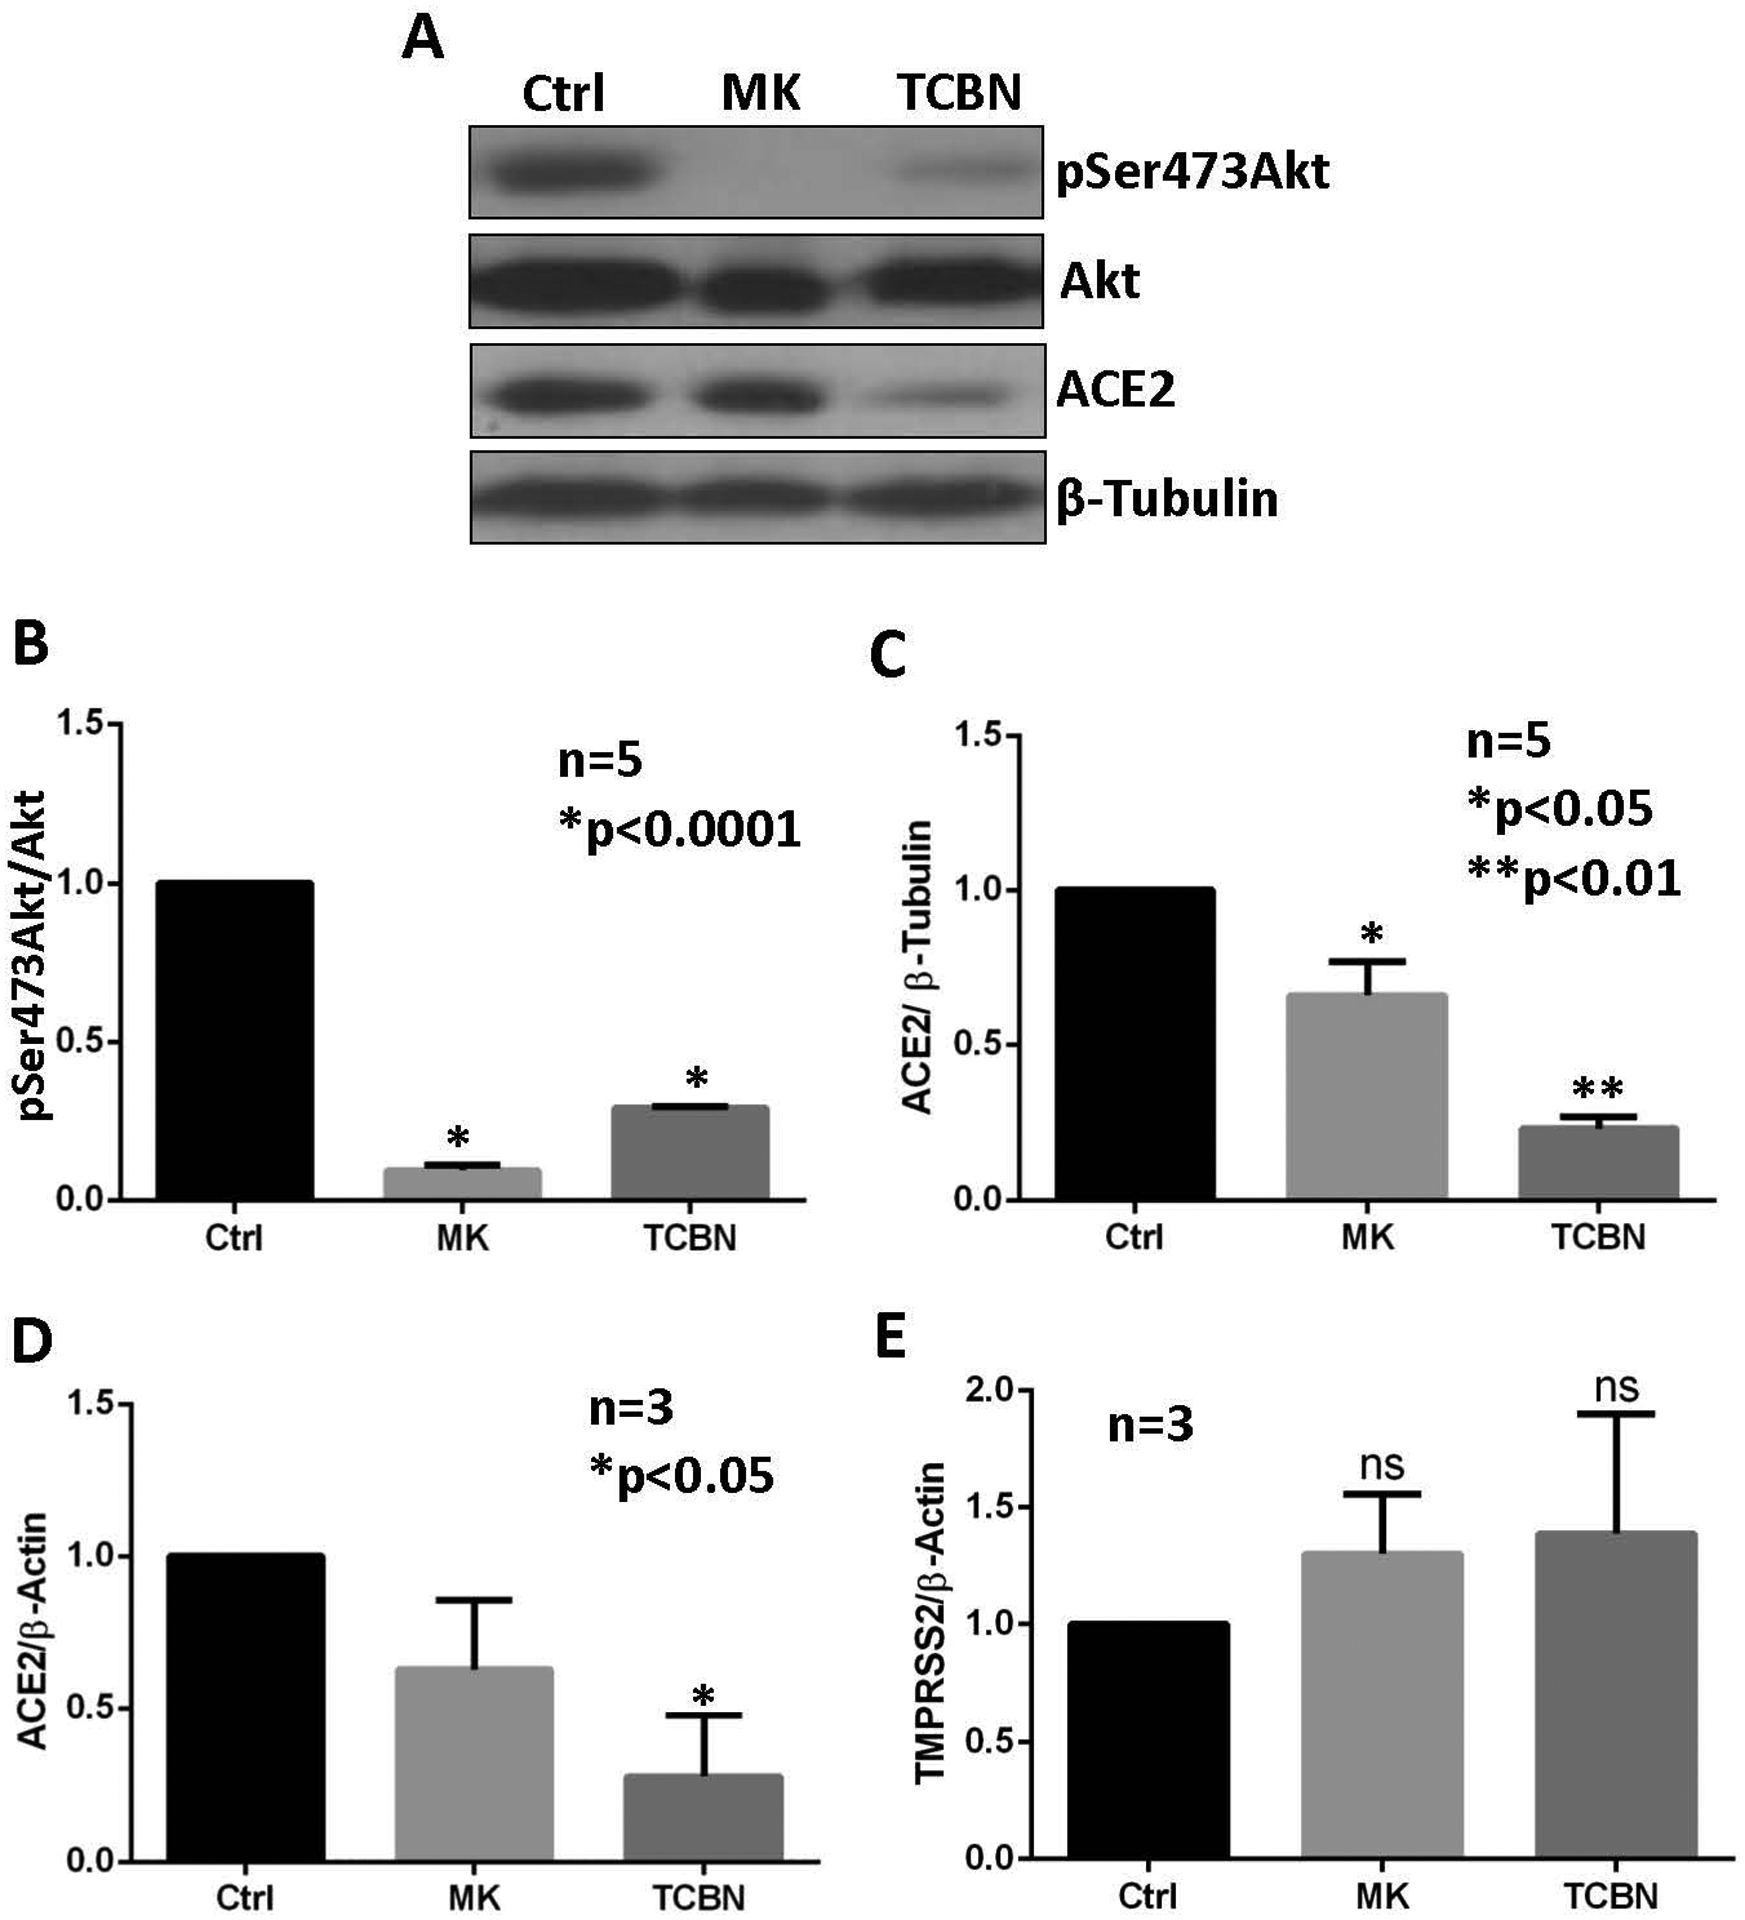
Figure 1. Treatment with TCBN suppresses ACE2 expression in A549 cells.

(A-C) Western blot images and bar graphs of band densitometry analysis of MK2206 (MK) and TCBN treated A549 cell lysates indicating changes in the expressions of ACE2, phosphorylated (Ser-473) Akt, and total Akt normalized to β-tubulin expression, respectively. (D-E) Bar graphs showing changes in the mRNA expression of ACE2 and TMPRSS2 normalized to the β-actin expression on MK2206 and TCBN-treated A549 cells compared to the vehicle (PBS) treated control. Data are shown as mean ± SEM.
