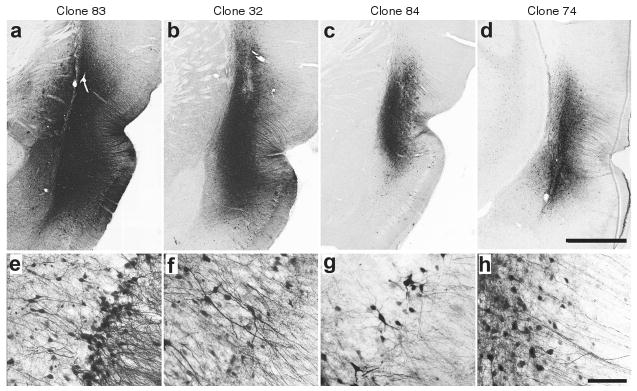
Figure 3. Immunohistochemical analysis of green fluorescent protein transgene expression, 2 weeks following injections of infectious clones into piriform cortex.

(a–d) Low-power photomicrographs of representative coronal sections showing the maximal dorsoventral extent of transduction around the site of injection. Bar = 1 mm for a–d at equal magnification. (e–h) Higher power images from sites depicted in a–d, demonstrating predominant neuronal tropism. Bar = 50 μm for e–h at equal magnification. (a,e) Clone 83; (b,f) clone 32; (c,g) clone 84; (d,h) clone 74.
