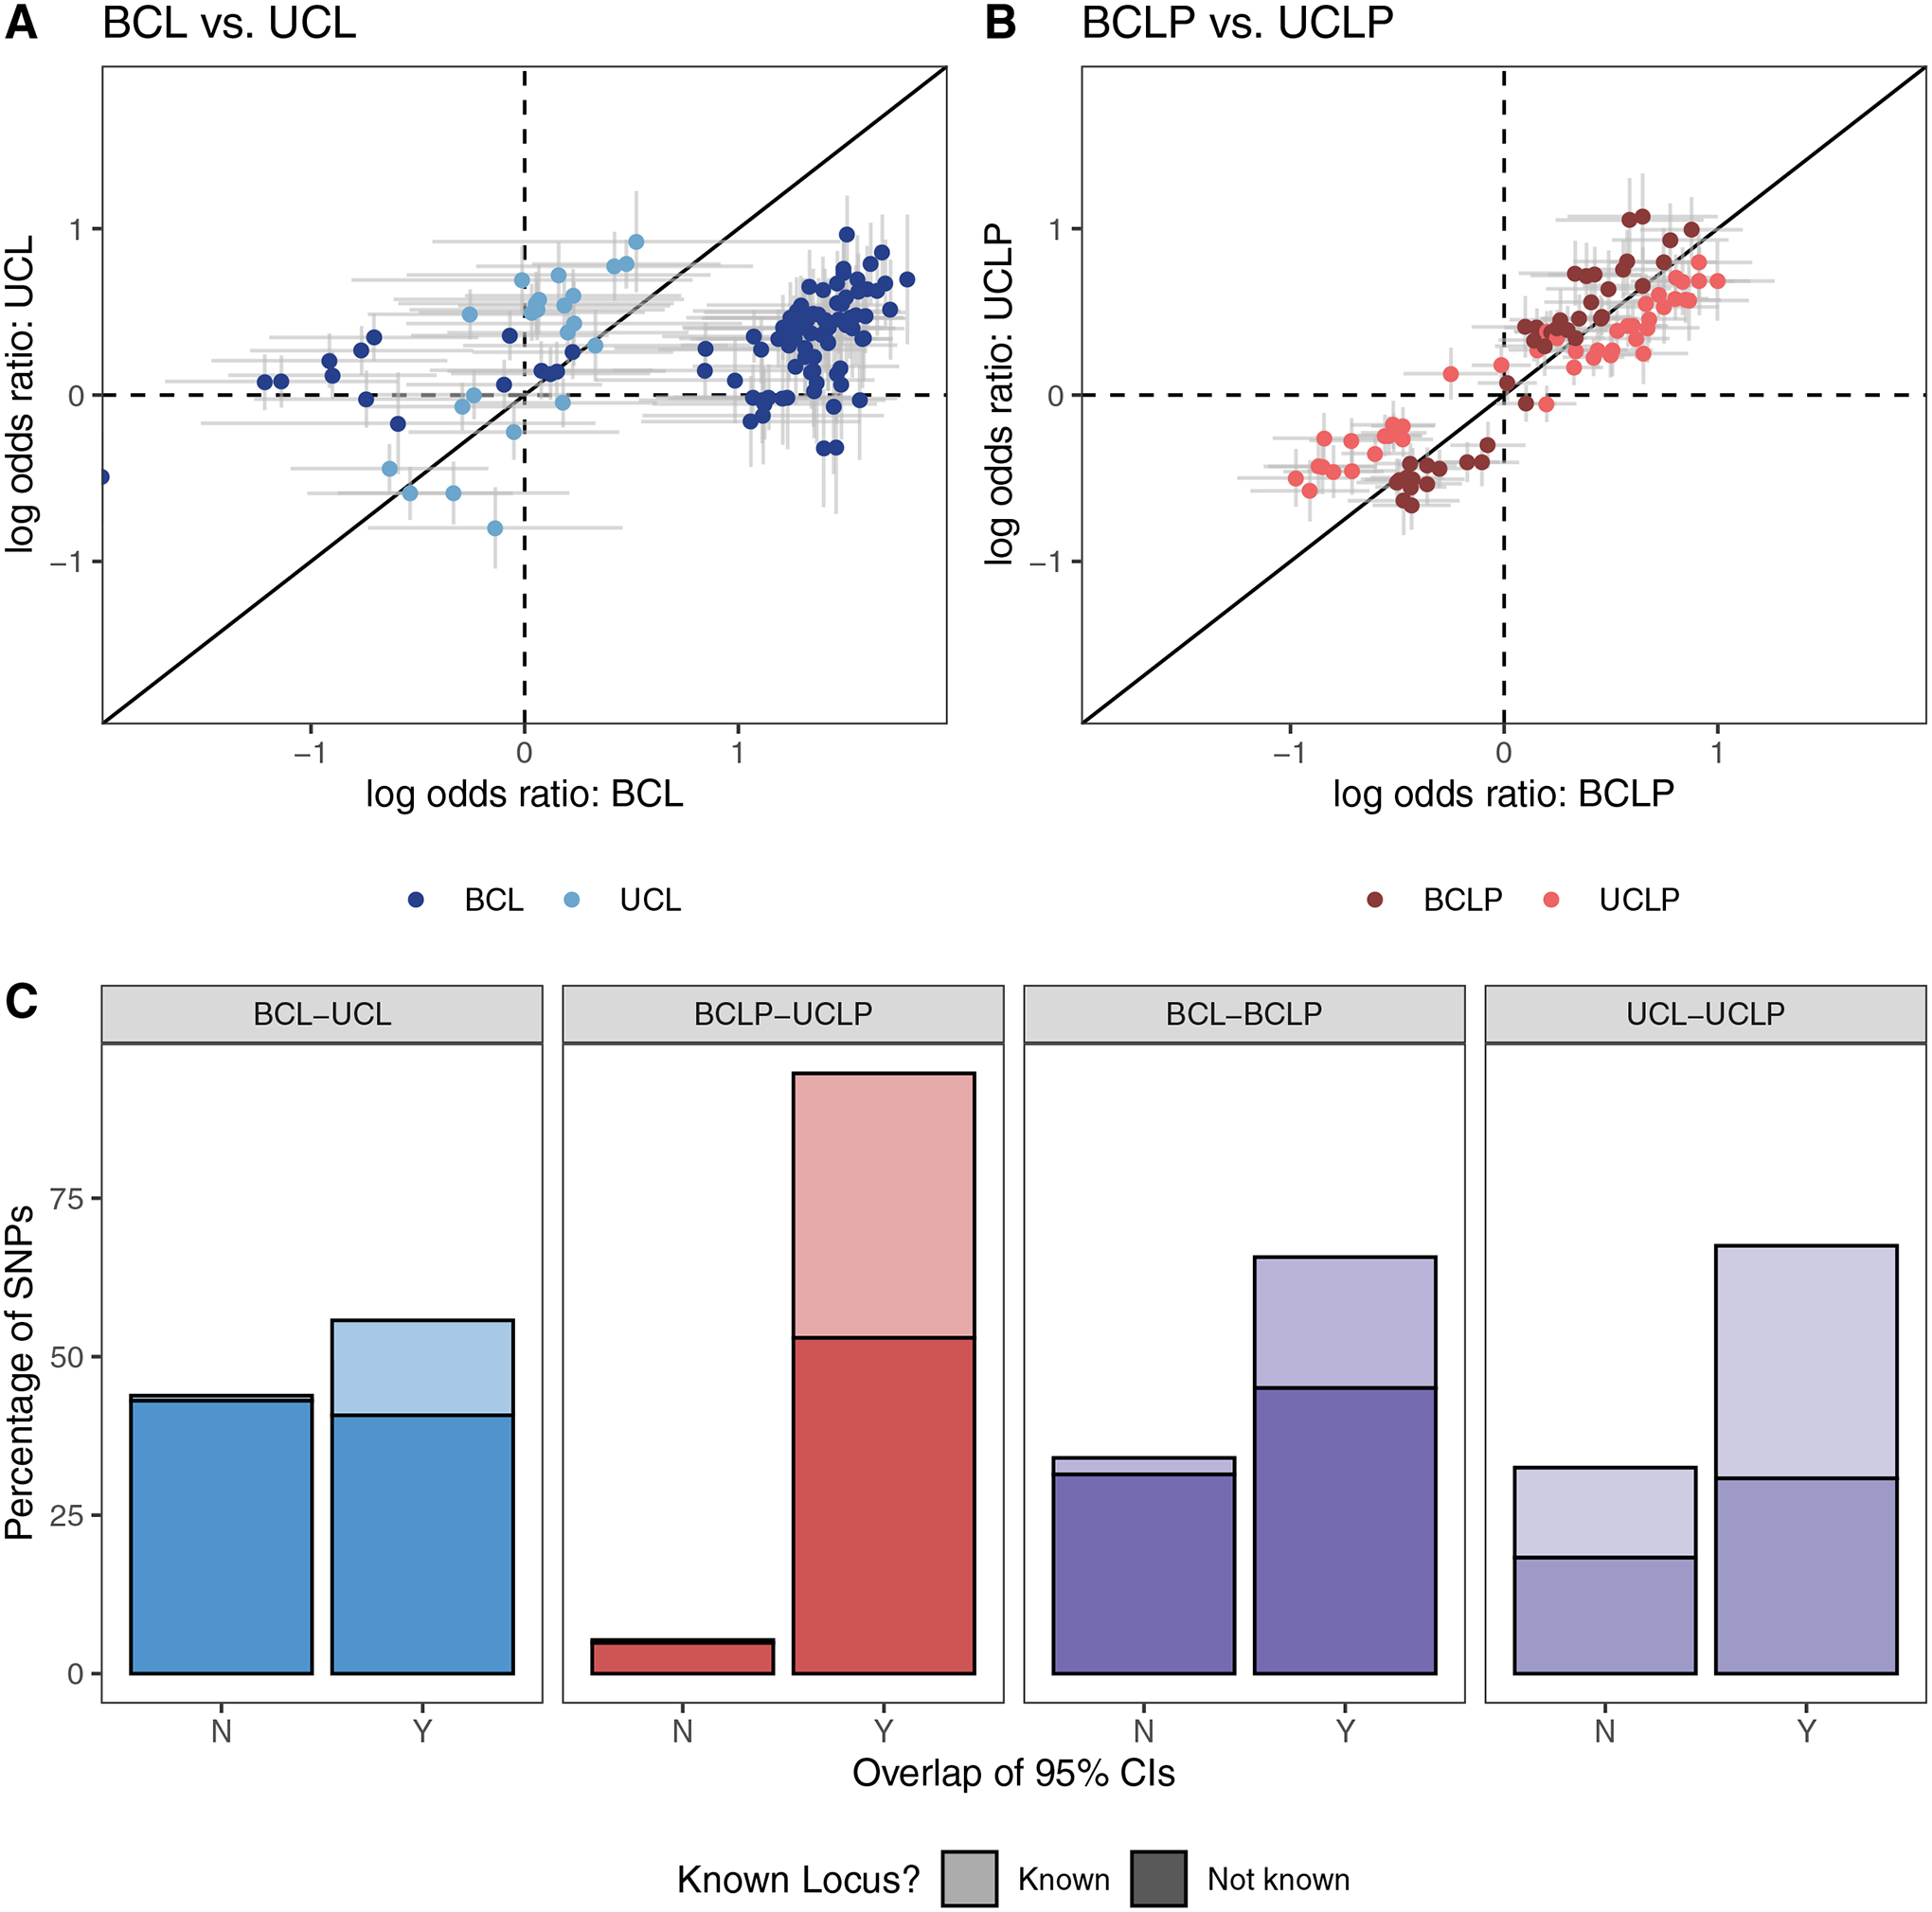
Figure 1: Subtype-specific analyses.

The log odds ratio for SNPs that were suggestive (p < 1 × 10⁻⁵) or significant (p < 5 × 10⁻⁸) in the subtype-specific case-control analyses in were compared between BCL and UCL (A), BCLP and UCLP (B), and were classified by whether the confidence interval for the odds ratio overlapped and whether the variant was known (C).
