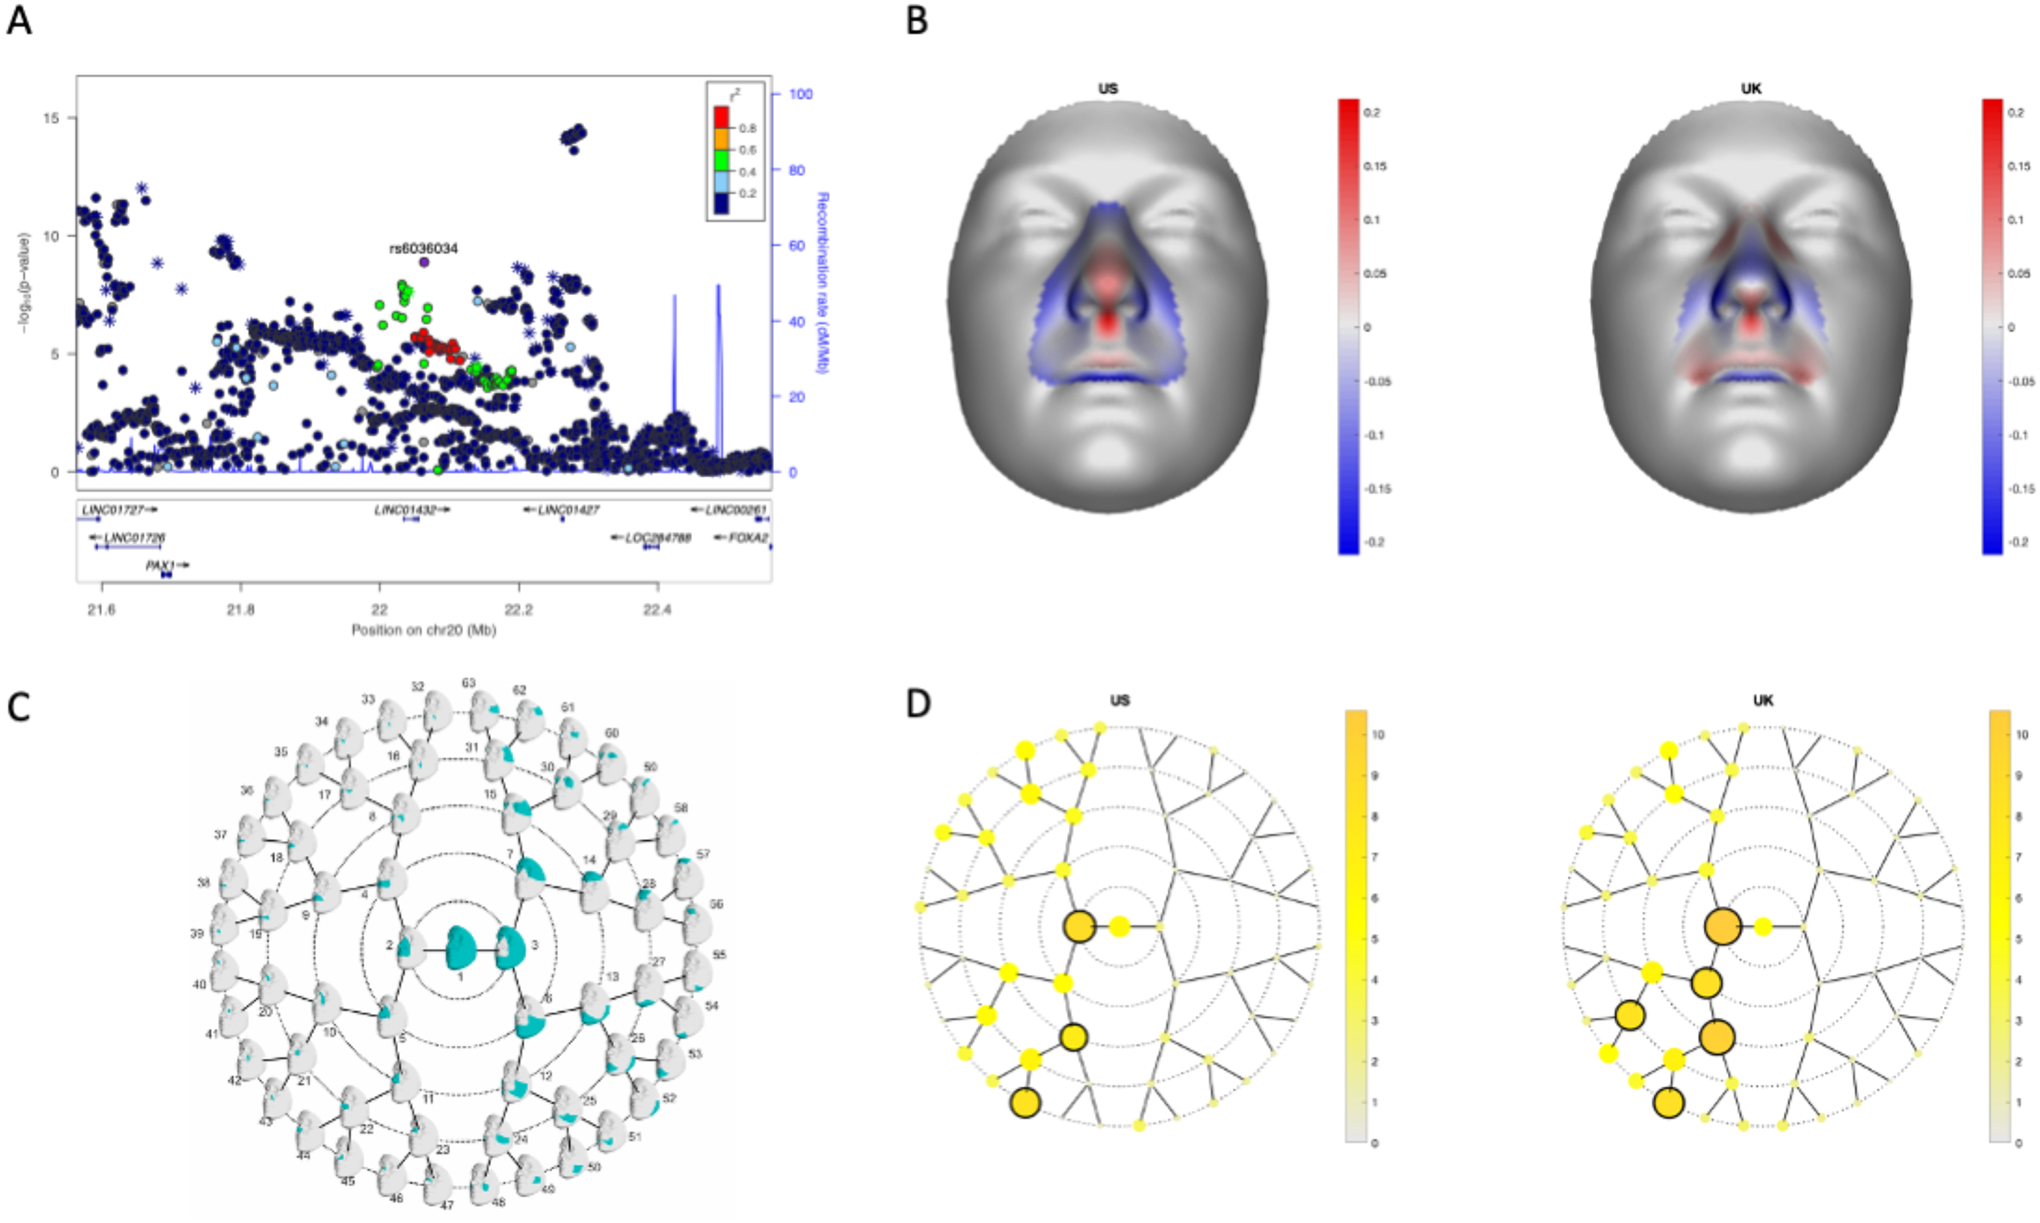
Figure 5: 20p11 is associated with normal facial variation.

LocusZoom plots for the association of normal facial variation and rs6036034 (A). Points are color-coded based on linkage disequilibrium (R2) in Europeans. The asterisks represent genotyped SNPs, the circles represent imputed SNPs. The normal displacement (displacement in the direction locally normal to the facial surface) in each quasi-landmark of the facial segment reaching the lowest p-value in MetaUS and MetaUK going from the minor to the major allele SNP variant (B). Blue, inward depression; red, outward protrusion. Global-to-local facial segmentation plot that shows the 63 facial segments represented in teal obtained using hierarchical spectral clustering (C). The -log10(p-value) of the meta-analysis p-values per facial segment in MetaUS and MetaUK. Black-encircled facial segments have reached a genome-wide p-value (p = 5.00×10⁻⁸) (D).
