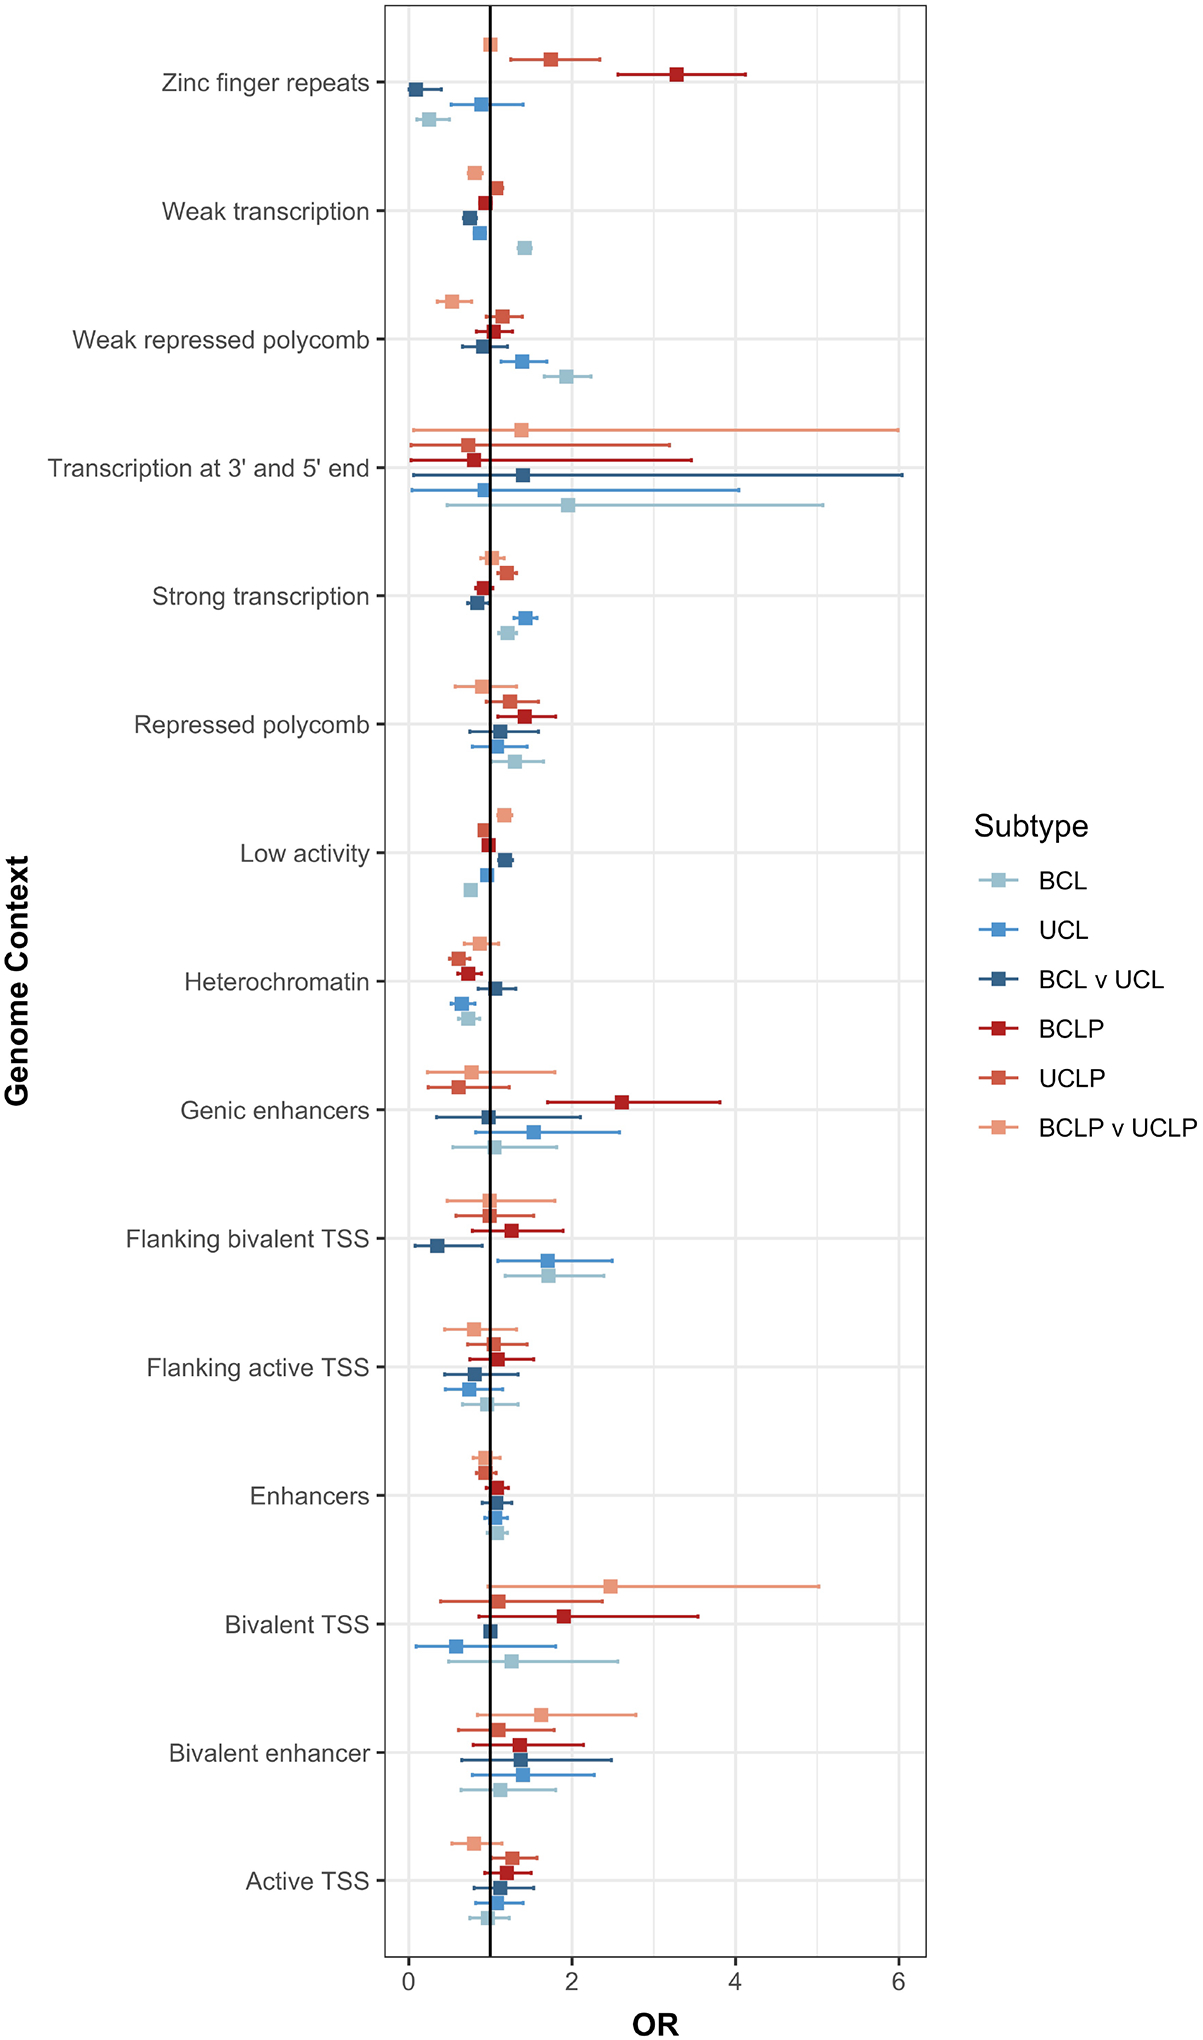
Figure 6: Functional enrichment.

Enrichment of the top SNPs associated in either the CL modifier analysis, CLP modifier analysis, and each subtype analysis (p < 1 × 10⁻³) were tested in each functional region defined during craniofacial development (CS15).
