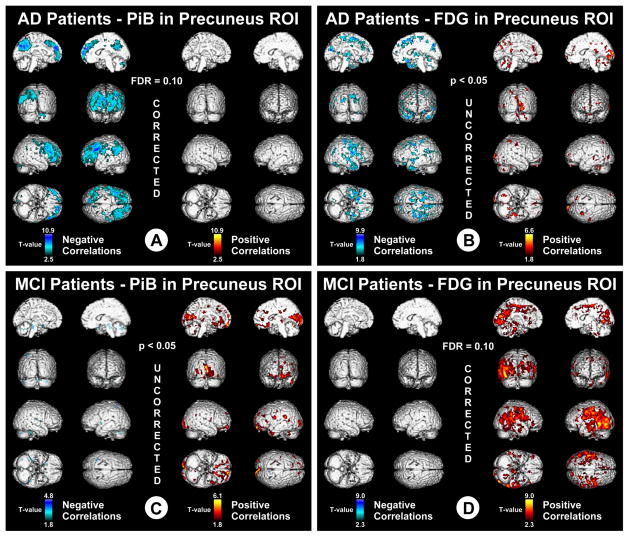
Figure 2.
Voxel-based correlations in AD and MCI. A, T values associated with negative correlations (blue) and positive correlations (red) in AD, between PiB retention in the bilateral/combined precuneus ROI and voxel-based measures of metabolism throughout the brain. Data are thresholded with FDR control at q = 0.1. B, T values associated with negative correlations (blue) and positive correlations (red) in AD, between FDG metabolism in the bilateral/combined precuneus ROI and voxel-based measures of PiB retention throughout the brain. Data are thresholded at an uncorrected p < 0.05. C, T values associated with negative correlations (blue) and positive correlations (red) in MCI, between PiB retention in the bilateral/combined precuneus ROI and voxel-based measures of metabolism throughout the brain. Data are thresholded at an uncorrected p <0.05. D, T values associated with negative correlations (blue) and positive correlations (red) in MCI, between FDG metabolism in the bilateral/combined precuneus ROI and voxel-based measures of PiB retention throughout the brain. Data are thresholded with FDR control at q = 0.1.

