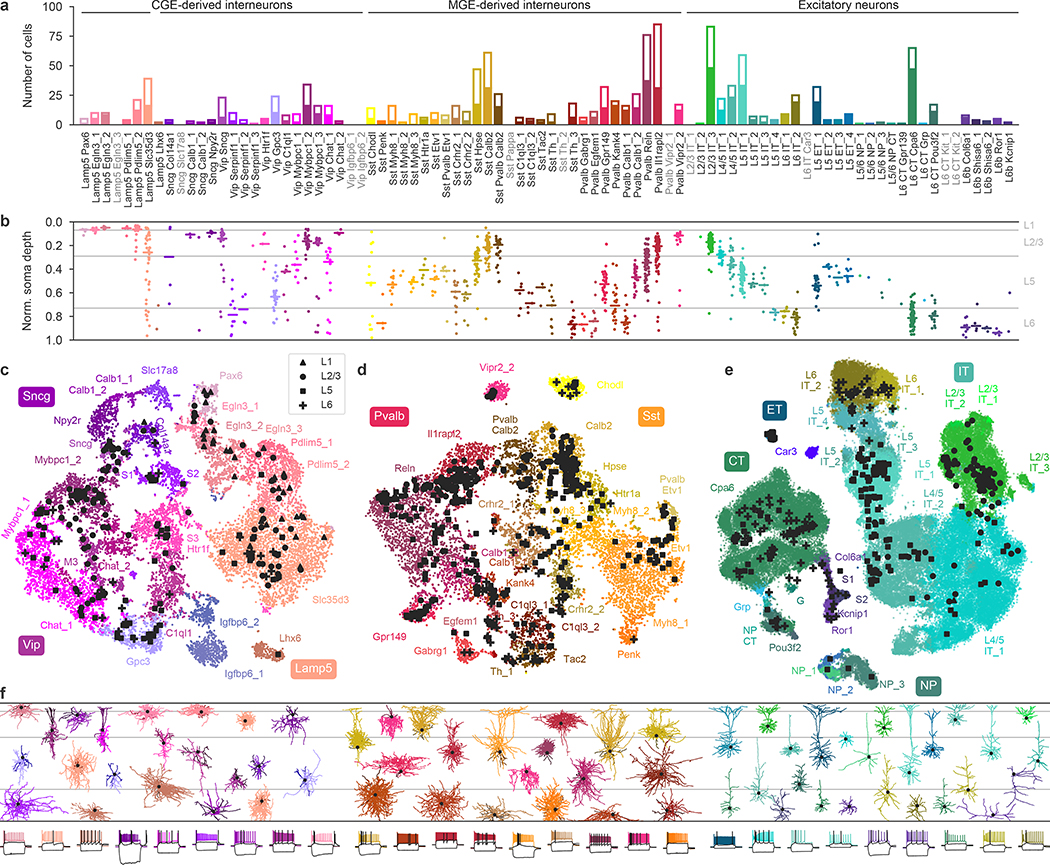
Fig. 1 |. Transcriptomic coverage.
a, Number of Patch-seq cells assigned to each of the neural transcriptomic types (t-types)20. Colours and the order of types are taken from the original publication20. The filled part of each bar shows the number of morphologically reconstructed neurons. Grey labels, t-types with no cells. Total number of neurons, 1,227. b, Normalized soma depths of all neurons of each t-type. For t-types with at least three cells, horizontal lines show medians. Soma depths were normalized by the cortical thickness in each slice (0, pia; 1, white matter). Grey horizontal lines, approximate layer boundaries identified by Nissl staining (L1, 0.07; L2/3, 0.29; L5, 0.73). Total number of neurons, 1,187 (for some cells soma depth could not be measured owing to failed staining). c, t-SNE representation of CGE-derived interneurons from the single-cell 10x v2 reference data set (n = 15,511; perplexity, 30). t-Type names are shortened by omitting the first word; some are abbreviated. Patch-seq cells from the Vip, Sncg, and Lamp5 subclasses were positioned on this t-SNE atlas23 (black symbols). d, As in c but for MGE-derived interneurons (n = 12,083; perplexity, 30). e, As in c but for excitatory neurons (n = 93,829; perplexity, 100). f, Example morphologies coloured by t-type. For interneurons, dendrites are shown in darker colours. For excitatory neurons, only dendrites are shown. Black dots mark soma locations. Three voltage traces are shown below for some exemplary cells: the hyperpolarization trace obtained with the smallest current stimulation, the first depolarization trace that elicited at least one action potential, and the depolarization trace showing maximal firing rate. Stimulation length, 600 ms.

