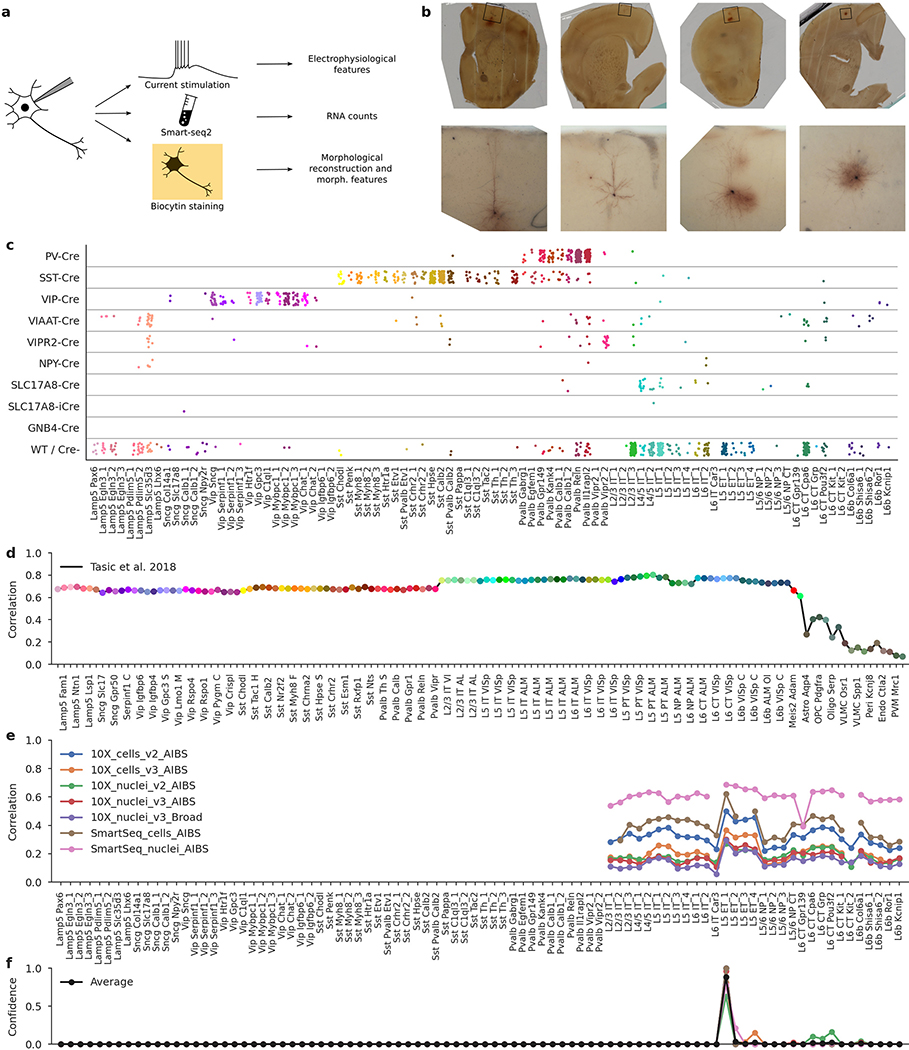
Extended Data Fig. 1 |. Patch-seq protocol, mouse Cre lines, and t-type assignment.
a, Patch-seq combines electrophyiological recordings, RNA sequencing using Smart-seq2, and biocytin staining in the same cell. b, Four exemplary slice images. Top: an image of the whole slice using 4x magnification. Bottom: a flattened 3D image stack using 20× magnification. From left to right: L5 ET neuron, L2/3 IT neuron, L5 Sst neuron, L5 Pvalb neuron. c, t-Types assigned to cells collected in mice from different Cre lines. ‘WT/Cre-’ stands for cells from any Cre line that were not labelled with a fluorescent indicator, or for the cells patched in wild type mice. 1,227 cells shown. d, t-Type assignment procedure for one example cell (d–f). Correlations to the mean log expression of all t-types from ref. 4, using 3,000 most variable genes. Maximum correlation is to the excitatory neurons. t-Type names are shortened, and every second one is omitted for compactness. e, Correlations to all excitatory t-types from ref. 20 using all seven reference data sets and 500 most variable genes. f, t-Type assignment confidences for all seven data sets, obtained via bootstrapping over genes. The average confidence is shown in black. The mode of the average confidence was taken as the final t-type.

