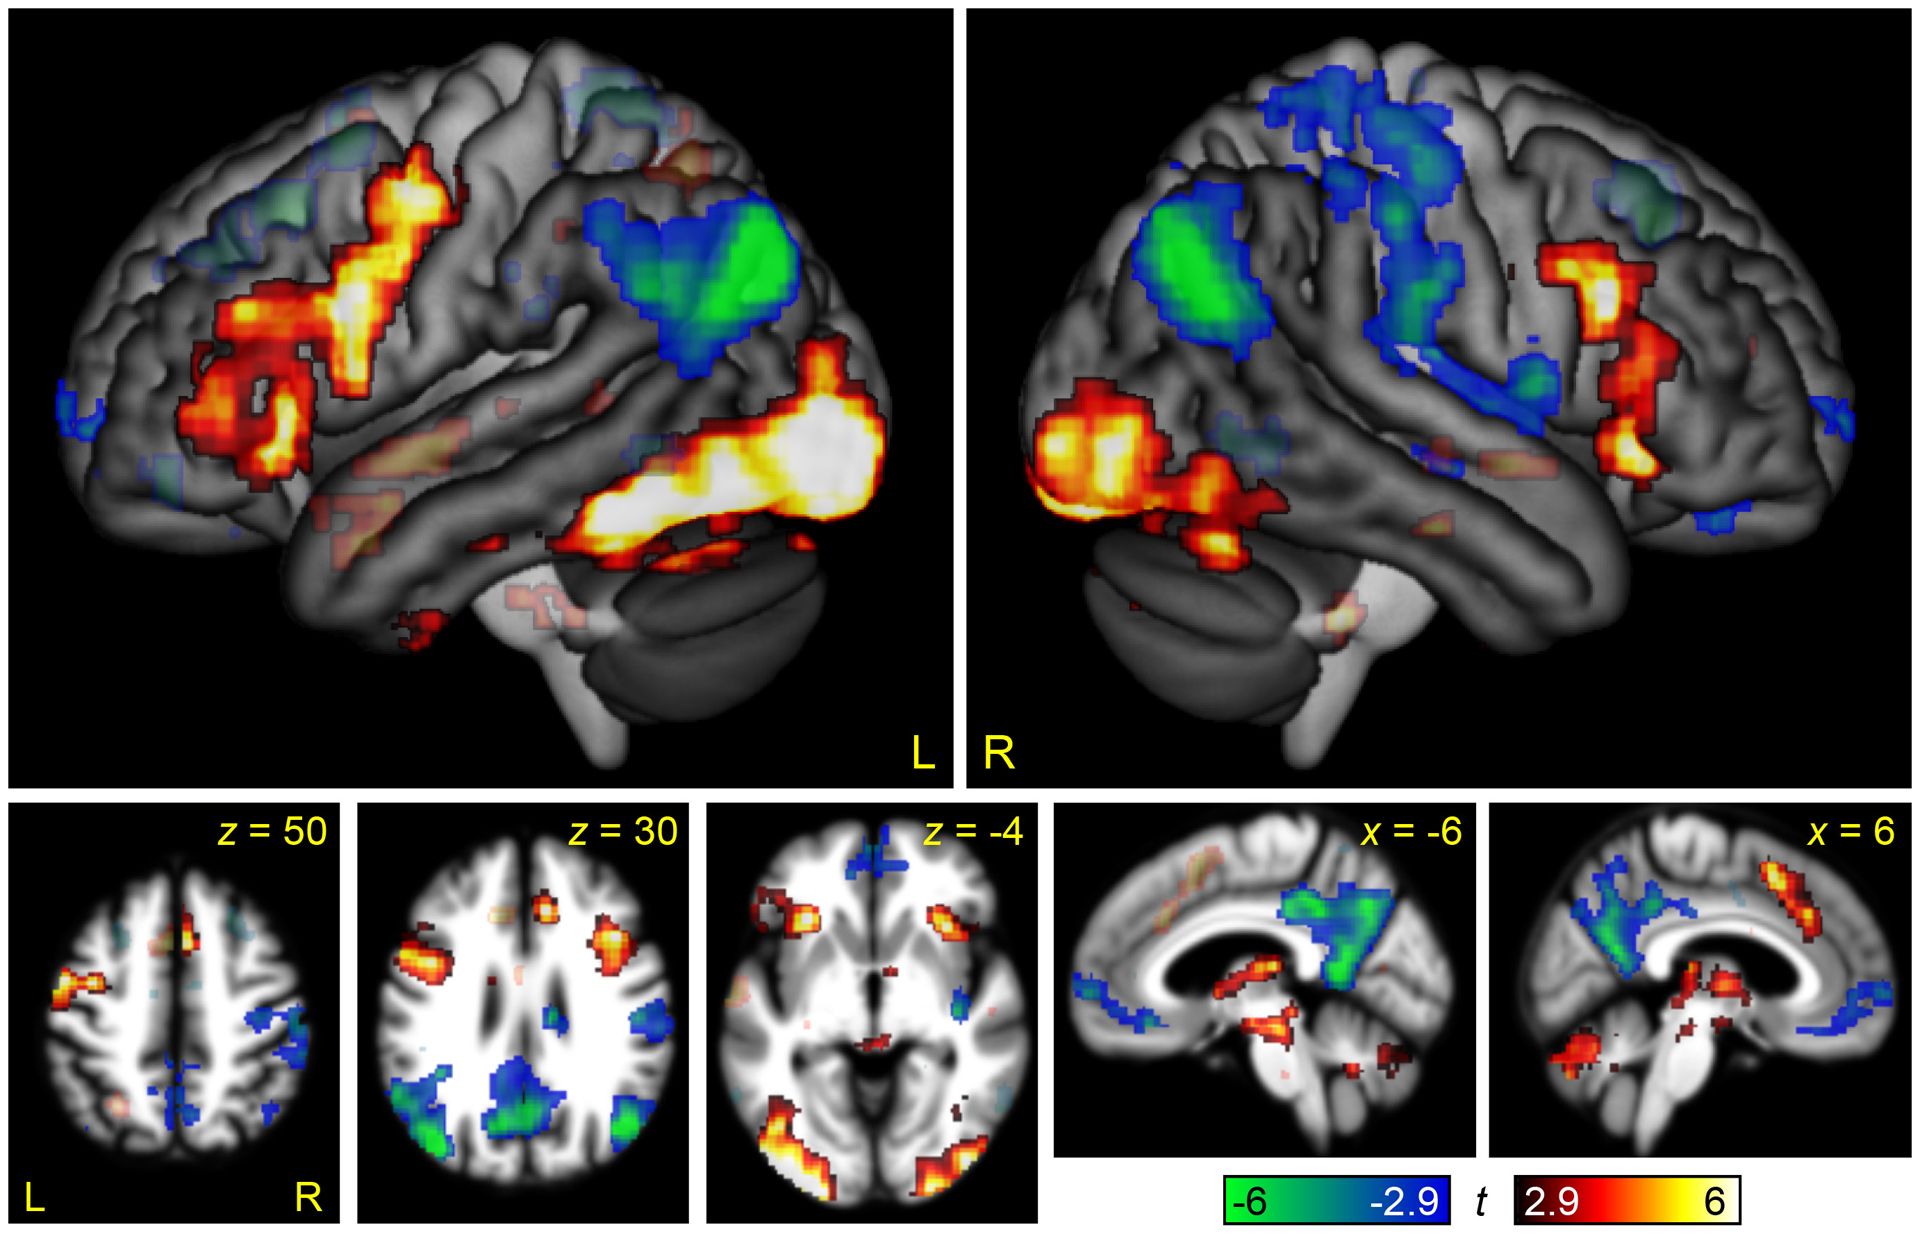
Figure 2.

Brain regions modulated by linguistic demand. The contrast between the Semantic Difficult and Semantic Easy conditions is shown in hot colors, while the reverse contrast is shown in cool colors. Opaque = statistically significant, corrected for multiple comparisons; transparent = voxelwise p < .005, but did not meet cluster extent threshold.
