
Figure 3.
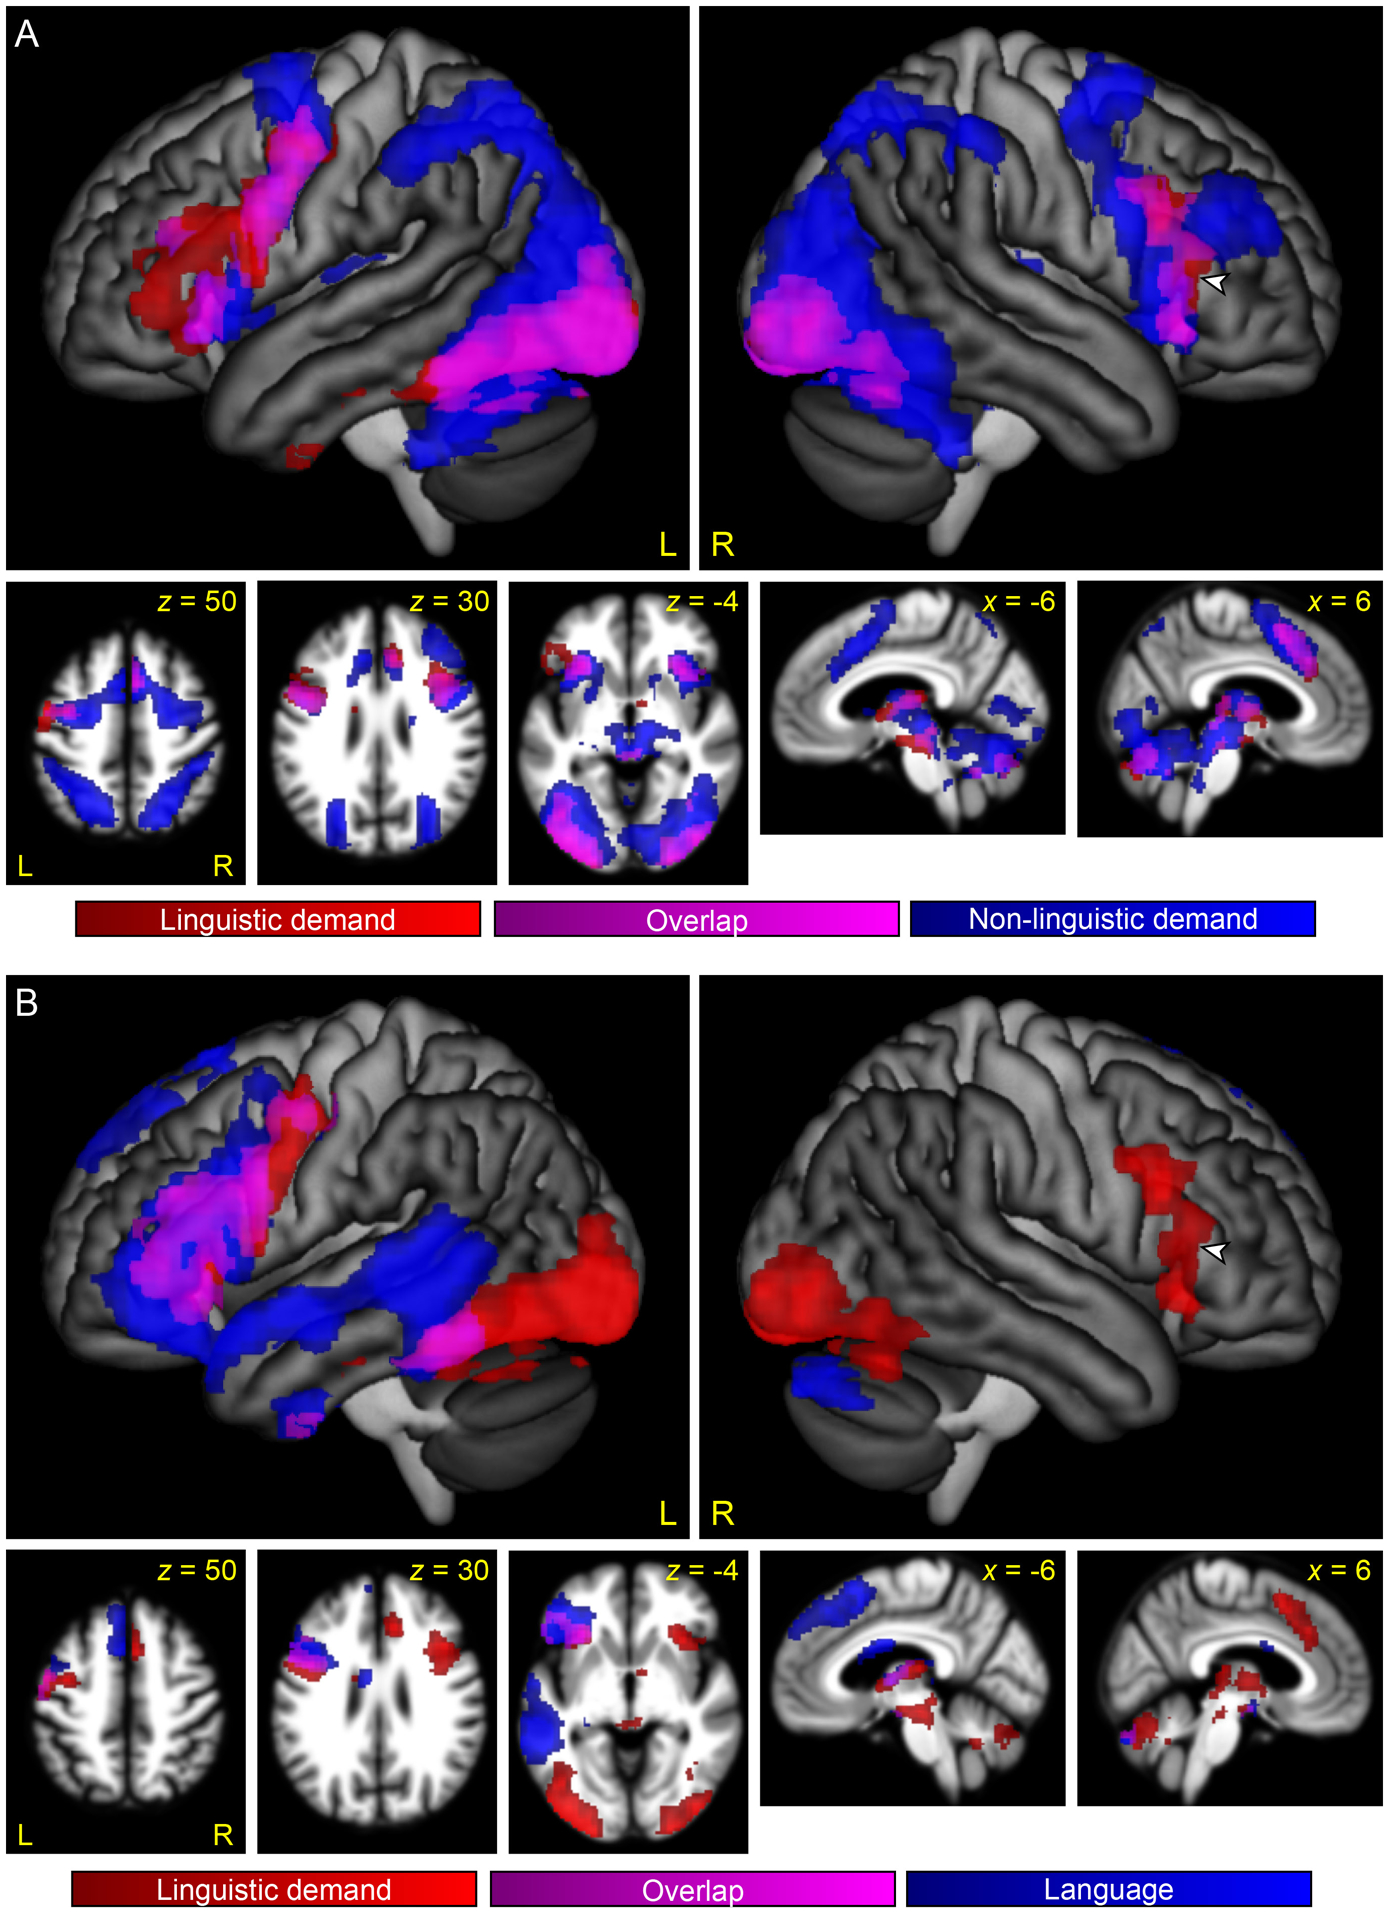
The relationship between regions modulated by linguistic demand, the multiple demand network, and the language network. (A) Regions modulated by linguistic demand are shown in red or violet. Regions modulated by domain-general demand, as revealed by the contrast between the Perceptual Difficult and the Perceptual Easy conditions, are shown in blue or violet. Violet indicates overlap. (B) Regions modulated by linguistic demand are shown in red or violet. Language regions, as revealed by the contrast of both semantic conditions to both perceptual conditions, are shown in blue or violet. Violet indicates overlap. Arrowheads indicate right IFG region that was modulated by linguistic demand, but was neither an MD region nor a language region.