
Figure 6.
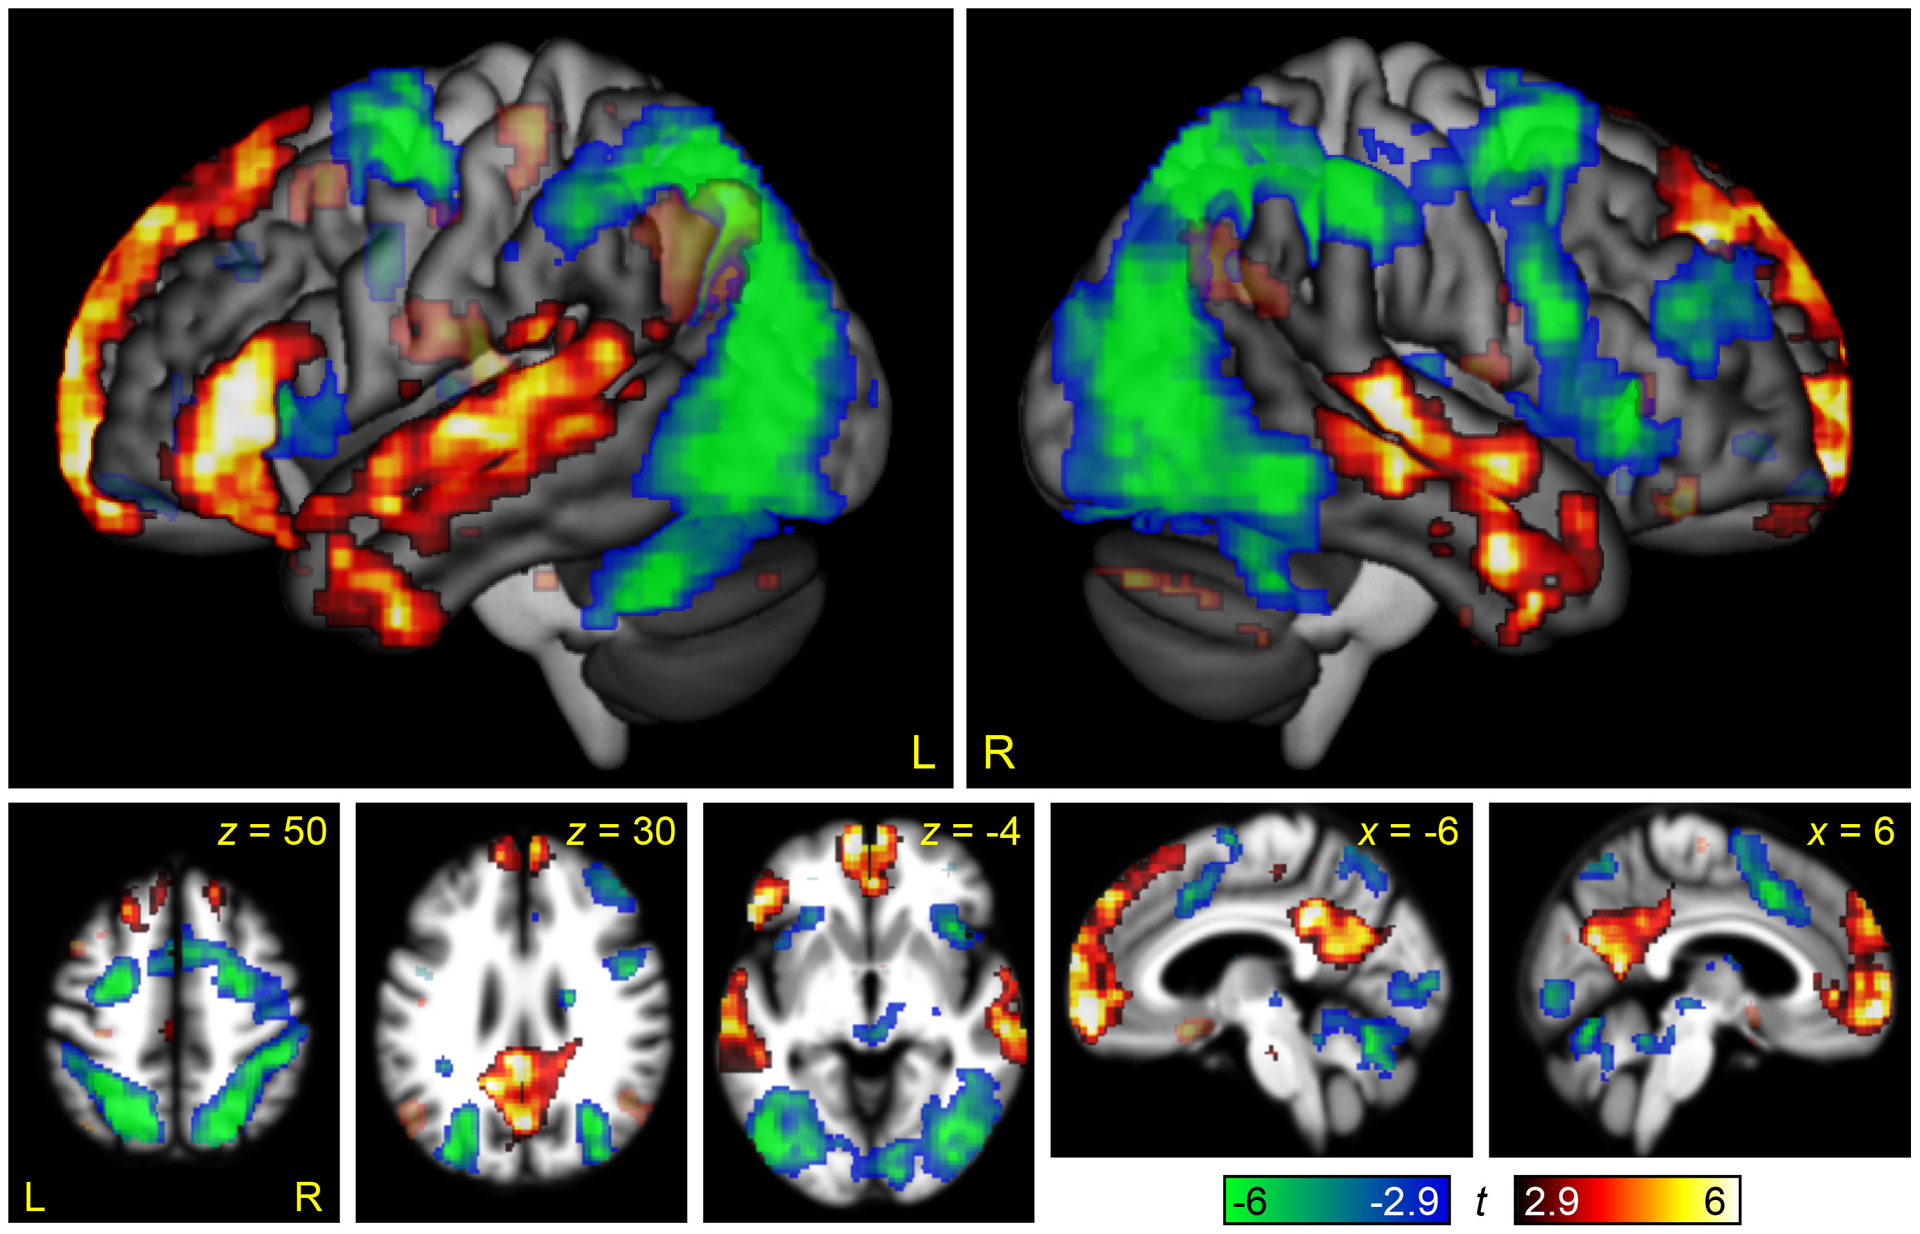
The interaction between linguistic demand and domain-general demand. Regions where modulation by linguistic demand was greater than modulation by domain-general demand are shown in hot colors, while the reverse contrast is shown in cool colors. Opaque = statistically significant, corrected for multiple comparisons; transparent = voxelwise p < .005, but did not meet cluster extent threshold.