
Figure 13.
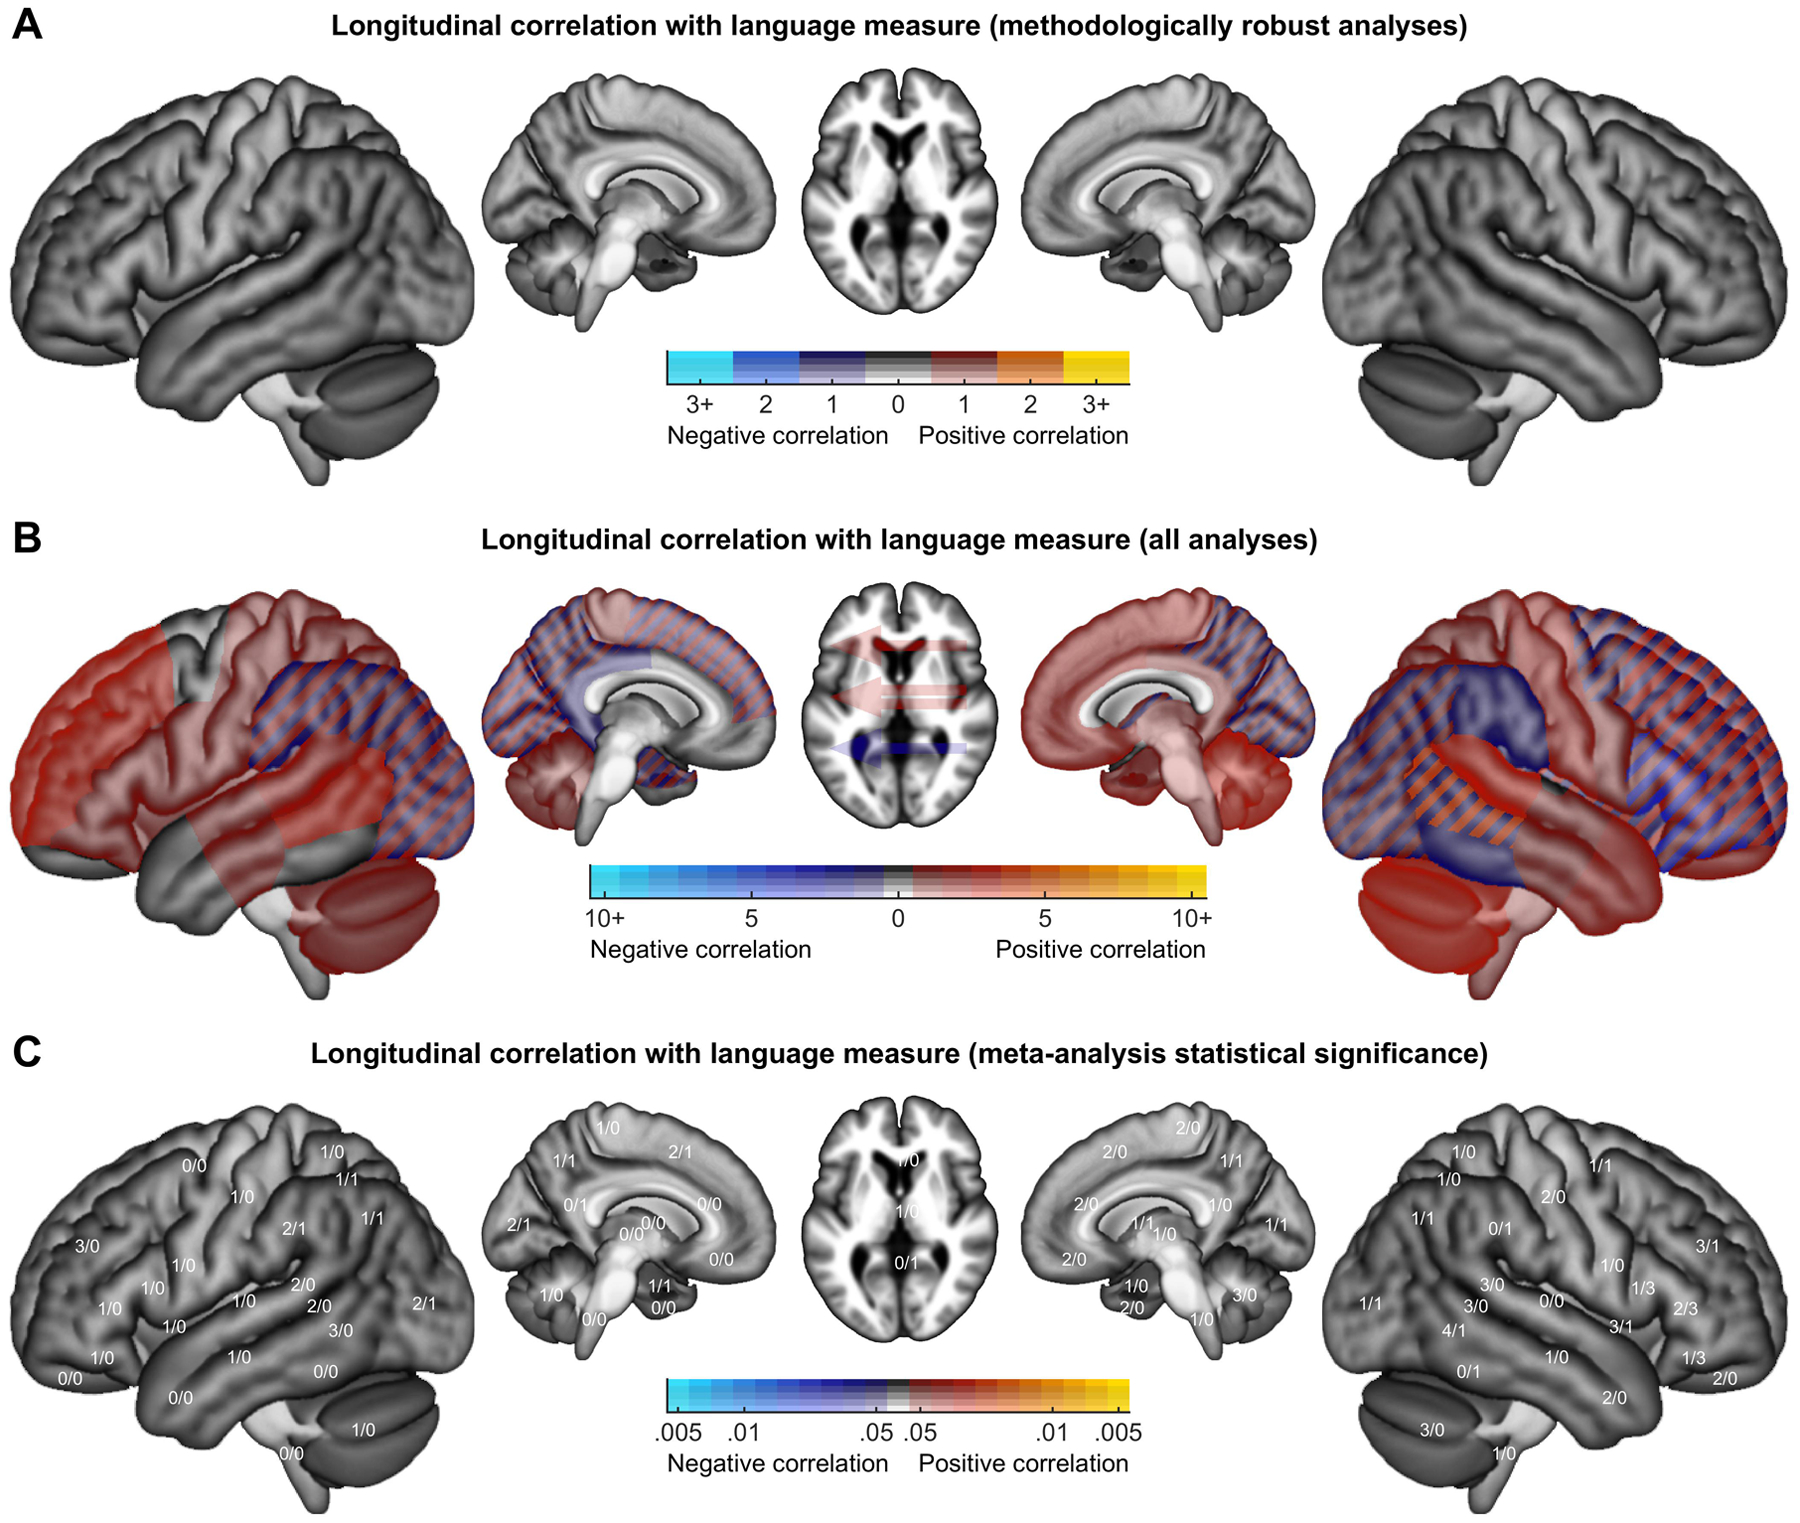
Findings from longitudinal correlations between change in activation and language measures. See Figure 10 caption for details, except that here, hot colors indicate positive correlations, while cool colors indicate negative correlations. Note that there were no analyses in this class that were appraised as methodologically robust.