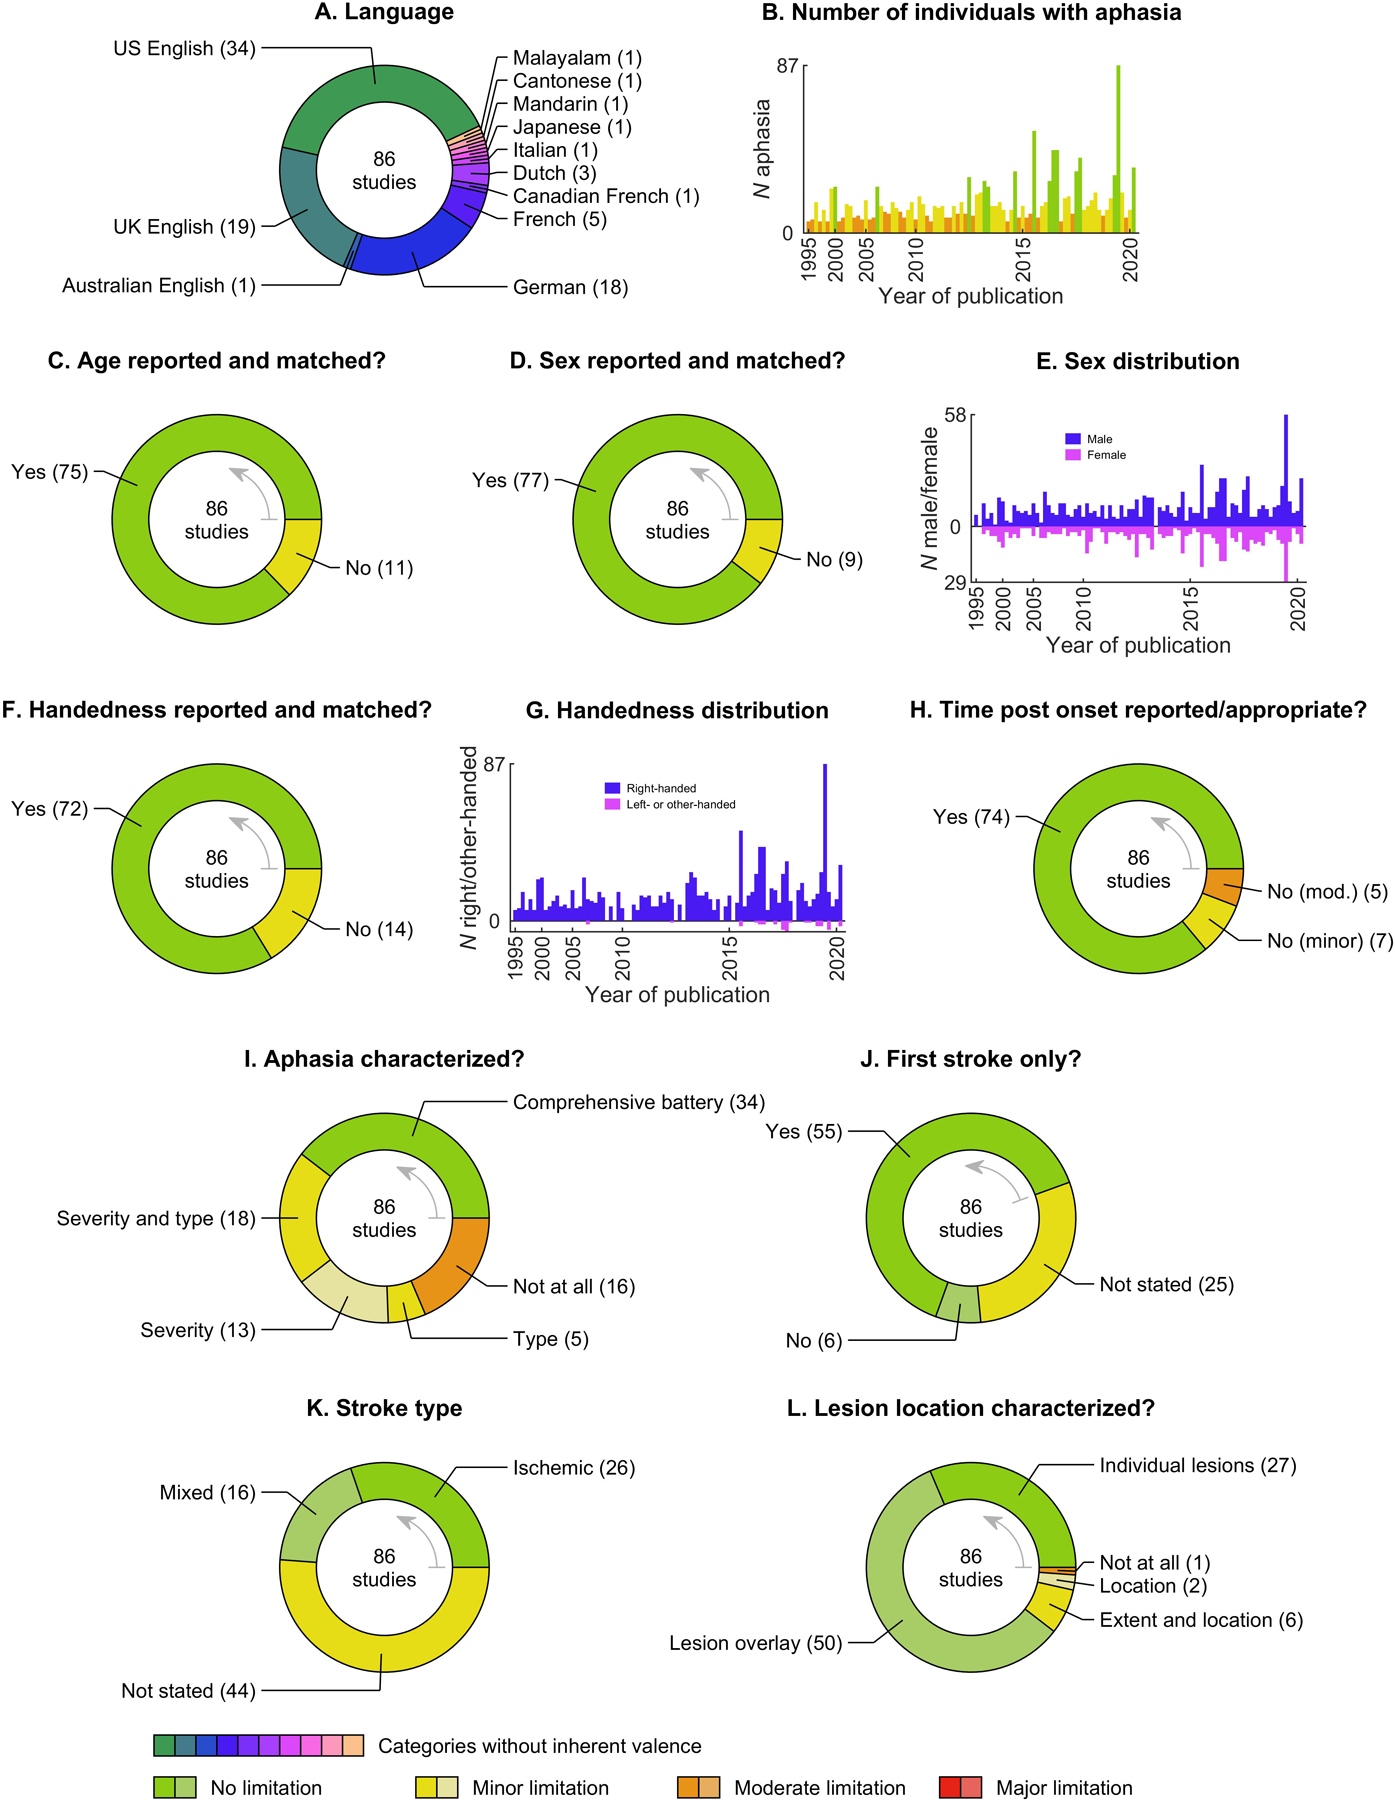
Figure 3.

Participants. Donut charts and bar graphs present information about the individuals with aphasia who participated in the 86 studies, and our appraisal of the extent to which sufficiently detailed information was provided about the participants. Note that two distinct color scales are used in this and the subsequent four figures: one for categories where there is no inherent valence, and another for those where limitations were assessed. In the latter case, donut plots are arranged with categories in descending order of quality, moving counterclockwise, as indicated by the light gray arrows.
