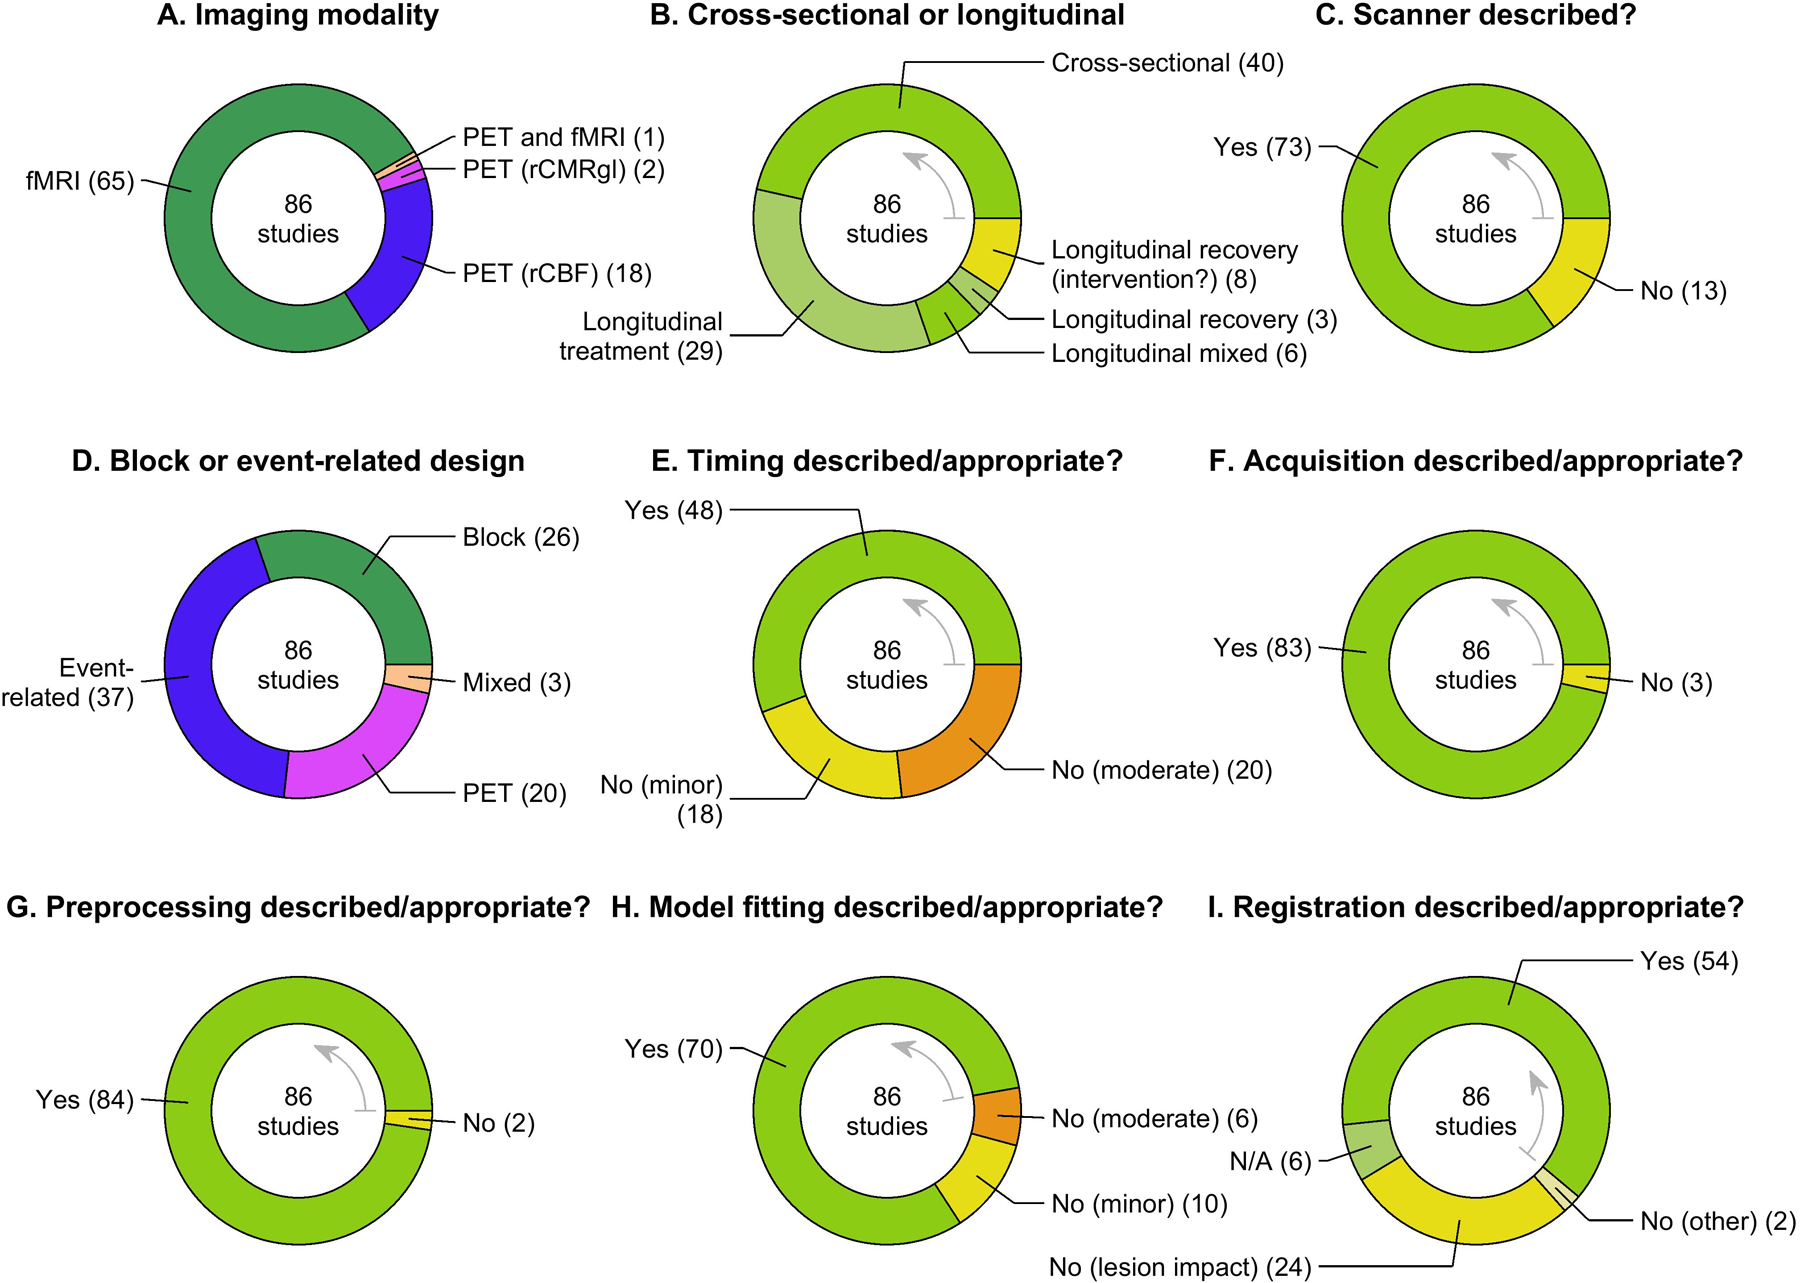
Figure 4.

Imaging. Donut charts present information about the imaging methods of the 86 studies, and our appraisal of the extent to which methods were described in sufficient detail, and appropriate. See Figure 3 caption for more information. rCMRgl = region cerebral metabolic rate for glucose; rCBF = regional cerebral blood flow.
