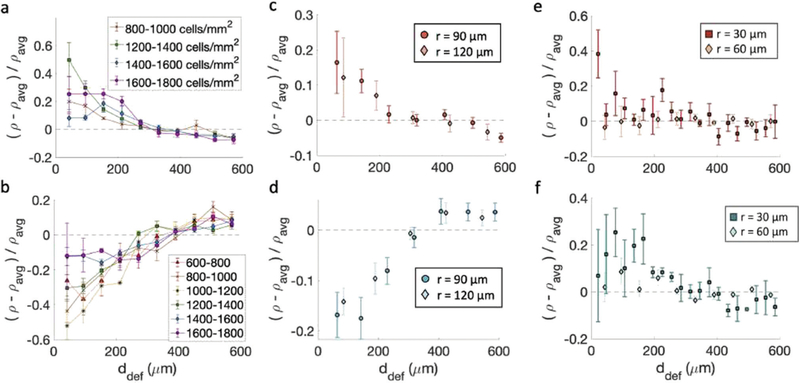
Fig. 4.
Density of cells near defects with positive and negative topological charge. (a and b) Density of fibroblasts near +1 (a) and −1 (b) defects for monolayers at different cell density on 60 μm-spaced, 1.5 μm-tall ridges. The legend indicates the density range in cells per mm2. Note that for (a) the cell density was calculated from the fluorescence intensity and not by nuclear counting, as discussed in the Methods section. (c and d) Density of fibroblasts as a function of distance from the defects +1 (c) and −1 (d) defects. The data refer to patterns with different sizes. (e and f) Density of epithelial cells near +1 (e) and −1 (f) defects. All densities are normalized by the average density of each pattern. Statistical analysis of this figure are reported in Methods. Briefly, an increase in cell density is observed within 200 μm of a +1 defect with a p-value <0.05 for cells at all densities in (a), the 90 μm pattern in (c), and the 30 μm pattern in (e). A decrease in cell density is observed within 200 μm of a −1 defect with p-values < 0.05 for cells at densities < 1600 cells per mm2 in (b), both patterns in (d), and the 30 μm pattern in (f).

