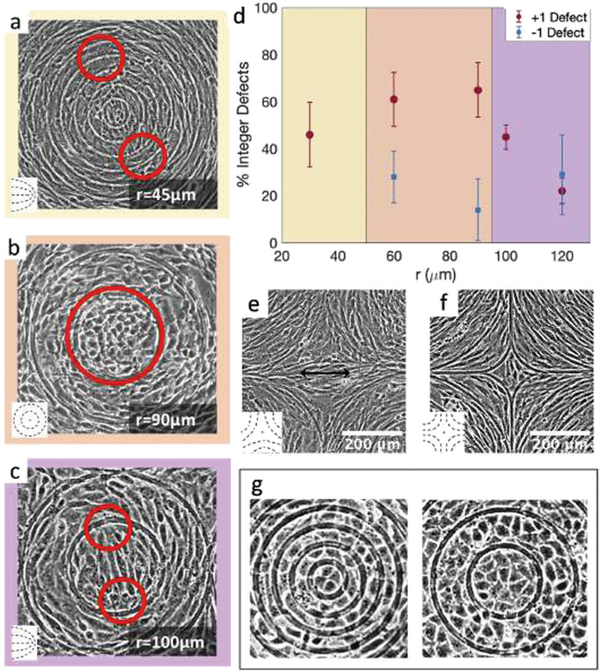
Fig. 6.
Examples of cell alignment near the positive and negative defects. (a) 3T6 fibroblasts with defect splitting into two +1/2 defects far from the inner ring, (b) isotropic region in the inner ring, indicating a +1 defect, and (c) defect splitting into two +1/2 defects in the inner ring. (d) Fraction of observed integer defects (as opposed to two half-integer defects), both for positive and for negative defects. Comparing r =60 μm patterns (n = 18 samples) to r = 120 μm patterns (n = 60 samples), the prevalence of +1 defects was higher for the 60 μm pattern (p-value = 0.0015). (e and f) Cells near −1 defects with an elongated (e) or more isotropic (f) conformation. Insets display the type of defects observed in the cell alignment. (g) Rosette structure near +1 defects in EpH-4 epithelial cells in patterns by 30 and 60 μm.

