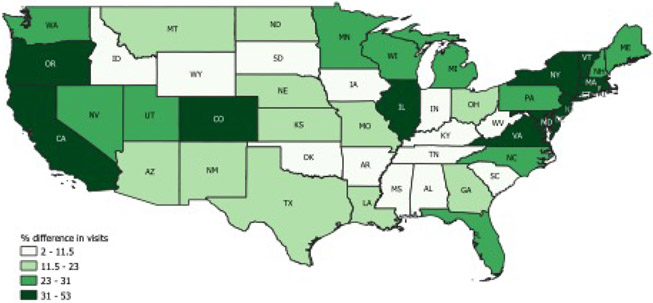
Figure 2. State-level percent differences in weekly visits to dental offices during March to August between 2019 and 2020.

Map reflects the state-level unadjusted differences in weekly visits to dental offices from March 8 through the week of August 23, 2020 compared to the same weeks in 2019. Weekly visits to dental office were tracked using smartphone location data.
