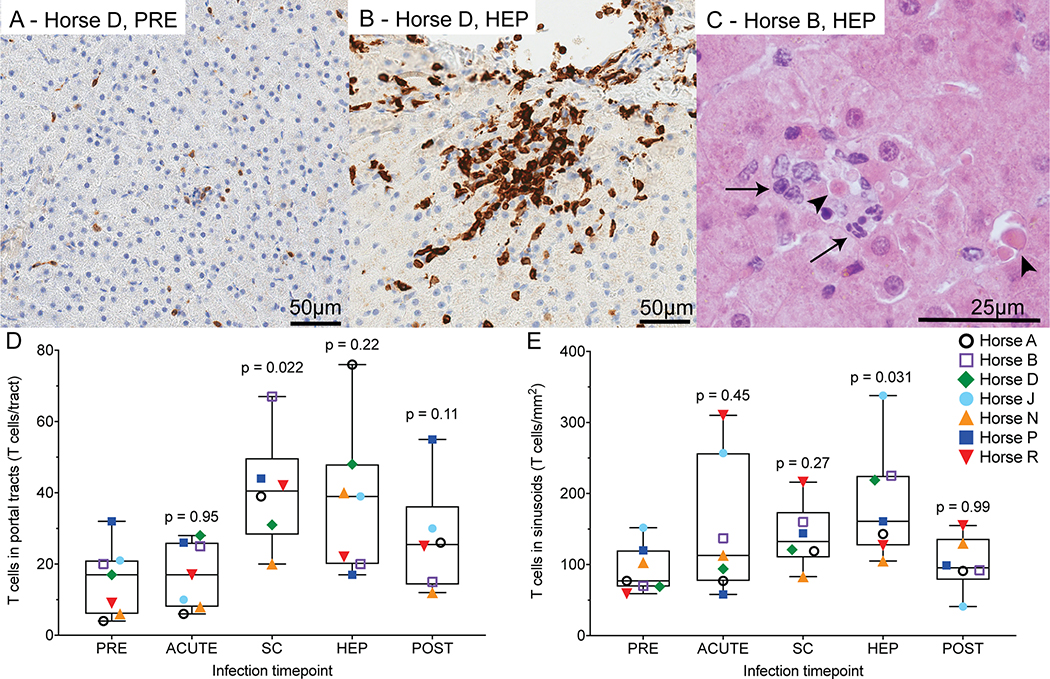
Fig 7: Liver histopathology is characterized by necrotic hepatocytes and T cell infiltrates.
(A,B) Anti-CD3 immunohistochemistry (brown) showing T cells for horse D pre-infection (A) and during hepatitis (B). (C) Hematoxylin and eosin staining of horse B during hepatitis showing individual necrotic hepatocytes (arrowheads), surrounded by lymphocytes and fewer neutrophils (arrows). (D,E) T cell infiltrates were compared across timepoints using a mixed effects model with horse as random effect (portal tracts p = 0.045, sinusoids p = 0.095). No horse effect was detected, therefore post-hoc Dunnett’s test was applied comparing T cell numbers at each time to pre-infection as shown. Horse D week 27 POST sample was excluded due to recrudescence of chronic EqHV infection and active hepatitis. PRE, pre-inoculation; SC, seroconversion; HEP, hepatitis; FV, falling viremia.

