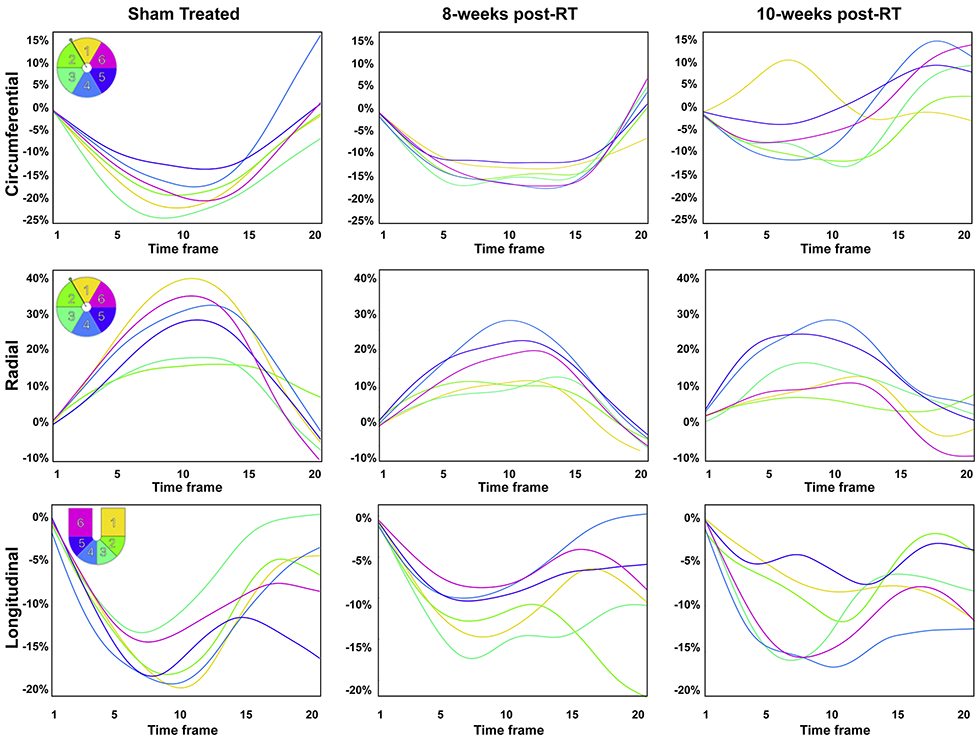
Figure 5. Strain curves in sham-treated and RT rats demonstrate reduced strain and altered patterns post-RT.
Representative circumferential, radial, and longitudinal strain curves across different myocardial segments in the left ventricle throughout the cardiac cycle in sham-treated, 8-weeks, and 10-weeks post-RT rats. Color code is shown in the upper left corner of the left panels for mid-ventricular short-axis segments (1, anterior; 2, anteroseptal; 3, inferoseptal; 4, inferior; 5, inferolateral; 6, anterolateral) and 4-chamber long-axis segments (1, basal-lateral; 2, mid-lateral; 3, apical-lateral; 4, apical-septal; 5, mid-septal; 6, basal-septal). The strain curves show strain values throughout the whole cardiac cycle (20 heart phases), starting with time frame #1 immediately after the ECG R-wave, through end-systole at time frame #9 or #10 until end-diastole at time frame #20. Overall, peak strain worsens post-RT. Furthermore, the curves show lack of synchrony for contraction of different segments at 10-weeks post-RT.

